Written by Sarah Conwell, Portfolio Manager
Headlines of the Week
- Suez Canal: Ships stuck in ‘traffic jam’ as salvage efforts continue
- Build America Bonds may be key to financing Biden’s infrastructure plans
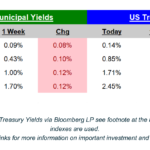
The US Treasury yield curve flattened in the week, with long-term yields declining roughly 9 basis points (bps). For reference, as of this writing, the 10-year/20-year/30-year yields are still 74/83/72 bps higher year-to-date, respectively, and the curve remains very steep when comparing today’s yield curve to the curve as of the end of last year.
Yesterday’s release of the third estimate of Q4 2020 Gross Domestic Product (GDP) improved by 0.2% to a 4.3% growth rate in the quarter. According to the Bureau of Economic Analysis, the “upward revision primarily reflected an upward revision to private inventory investment that was partly offset by a downward revision to nonresidential fixed investment”. The report also showed that corporate profits declined 1.4% in the fourth quarter and were 6% below 2019’s levels for the full year. Finally, this week’s Chart of the Week shows how nominal GDP has rapidly improved over the past year but remains below its pre-pandemic levels.
Today, Personal Income was released and declined 7.1% in February, as was largely expected with no stimulus checks to keep income growing at the double-digit pace seen in January. As a result, Personal Spending also slid a little, to -1.0% in the prior month, also relatively in-line with expectations. Since inflation is on everyone’s mind, it is worth noting that the PCE Deflator, the Fed’s gauge of inflation, increased a less-than-expected 0.2% and 0.1% on a headline and core basis in February. This leaves the headline and core year-over-year figure at 1.6% and 1.4% respectively.
Next week, we close out the end of the quarter with the Conference Board Consumer Confidence Index, and Initial Jobless Claims, the ISM Manufacturing Index, and a litany of labor market data will be released later in the week.
Chart of the Week
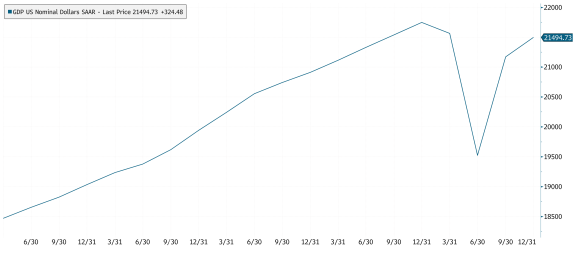
GDP US Nominal Dollars: third estimate of Q4 2020, not quite a return to pre-pandemic levels.
Source: Bloomberg, LP As of: 3/26/2021
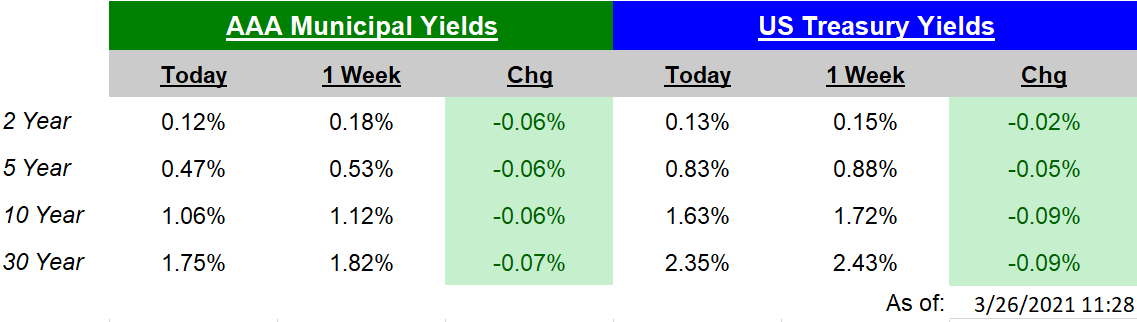
Source of Interest Rates: US Treasury Yields via Bloomberg LP see footnote at the bottom of this e-mail for which indexes are used. Click on the above links for more information on important investment and economic concepts.
Disclosures
Indexes used for AAA Municipal Yields
2 Year: BVAL Municipal AAA Yield Curve (Callable) 2 Year (Symbol: CAAA02YR BVLI)
5 Year: BVAL Municipal AAA Yield Curve (Callable) 5 Year (Symbol: CAAA04YR BVLI)
10 Year: BVAL Municipal AAA Yield Curve (Callable) 10 Year (Symbol: CAAA10YR BVLI)
30 Year: BVAL Municipal AAA Yield Curve (Callable) 30 Year (Symbol: CAAA30YR BVLI)
Indexes used for US Treasury Yields
2 Year: US Generic Govt 2 Year Yield (Symbol: USGG2YR)
5 Year: US Generic Govt 5 Year Yield (Symbol: USGG5YR)
10 Year: US Generic Govt 10 Year Yield (Symbol: USGG10YR)
30 Year: US Generic Govt 30 Year Yield (Symbol: USGG30YR) F/m Investments, LLC, doing business as Genoa Asset Management (Genoa), is an investment advisor registered under the Investment Advisers Act of 1940. Registration as an investment adviser does not imply any level of skill or training. The oral and written communications of an adviser provide you with information about which you determine to hire or retain an adviser. For more information please visit: https://adviserinfo.sec.gov/ and search our firm name. The opinions expressed herein are those of Genoa and may not come to pass. The material is current as of the date of this presentation and is subject to change at any time, based on market and other conditions. The information presented in the material is general in nature and is not designed to address your investment objectives, financial situation or particular needs. Prior to making any investment decision, you should assess, or seek advice from a professional regarding whether any particular transaction is relevant or appropriate to your individual circumstances. The information presented does not involve the rendering of personalized financial, legal or tax advice, but is limited to the dissemination of general information for educational purposes. Please consult financial, legal or tax professionals for specific information regarding your individual situation. This information does not constitute a solicitation or an offer to buy or sell any securities. Although taken from reliable sources, Genoa cannot guarantee the accuracy of the information received from third parties. Charts, diagrams, and graphs, by themselves, cannot be used to make investment decisions. Investing involves risk of loss, including loss of principal. Past performance is no guarantee of future results. An index is a portfolio of specific securities, the performance of which is often used as a benchmark in judging the relative performance of certain asset classes. Indexes are unmanaged portfolios and investors cannot invest directly in an index. An index does not charge management fees or brokerage expenses, and no such fees or expenses were deducted from the performance shown.