Written by Peter Baden, CFA, Chief Investment Officer
In case the market didn’t hear him at his press conference last Wednesday, Jerome Powell, the Acting Federal Reserve Chairman, gave a very clear speech on Monday at the 38th annual NABE Economic Policy Conference. One early quote:
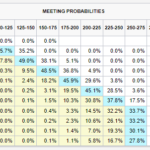
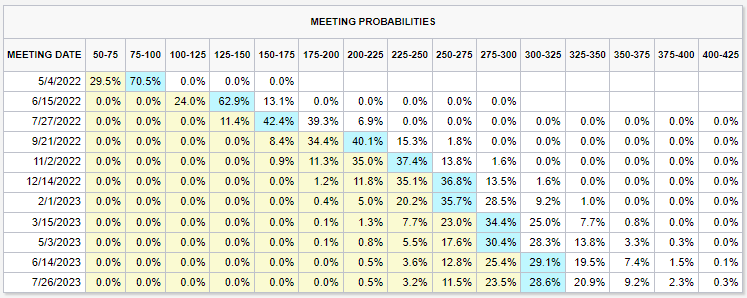
The bond market didn’t need to hear anything else. Prices fell and Interest rates jumped. The CME Fed Watch Tool is now reflecting two 50 basis point hikes this year and a potential December Overnight Fed Funds rate of 2.5-2.75%. Looking into 2023 there are expectations of two more 25 basis point hikes bringing the rate to around 3-3.25% in June 2023.
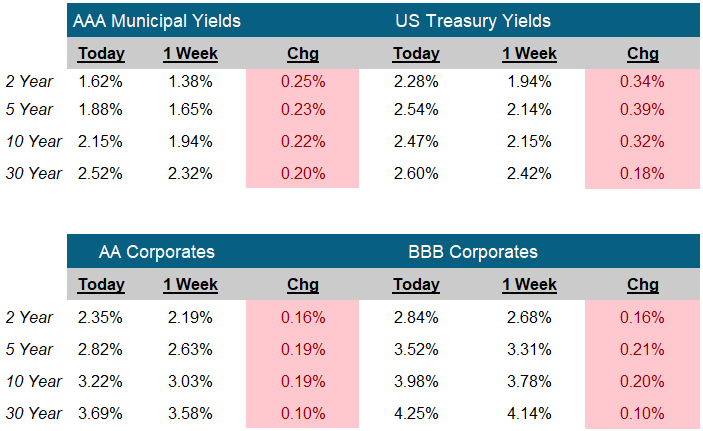
Meanwhile the yield on the benchmark Ten Year Treasury rose 32 basis points to 2.47%. The yield on the benchmark two Year Treasury rose 34 basis points to 2.28%. The curve flattened somewhat, with the spread between the 2 and 10 Year Treasury at 19 basis points (as of this writing, around noon on Friday).
Looking across the various sectors in the fixed income market, they are all responding to higher US Treasury rates, the Russian invasion of Ukraine and outflows from ETF’s and mutual funds.
Tax-Free Municipals
The broad market municipal index is down 5.88% from the beginning of the year thru yesterday March 24th. Municipal yields, as a percentage of U.S. Treasuries, have also deteriorated. As of year-end 2021, 10 year AAA Muni bonds were yielding 69% of 10 year U.S. Treasuries. Today that percentage has increased to 90%. This despite the improving credit quality of municipal bonds. Federal stimulus payments over the past two years have improved the balance sheets of municipalities throughout the country along with much higher than projected tax receipts for 2021 and YTD 2022. With higher absolute rates along with the higher percentage vs U.S. Treasuries, the after-tax yield on high grade municipal bonds is now attractive versus investment grade corporate bonds and U.S. Treasury bonds. If we assume a 35% tax rate, the 2.15% pre-tax yield on the 10-year AAA Muni equates to an after-tax yield of 3.31%
Corporate Bonds
For corporate bonds, spreads widened, as fears increased. Corporate bonds are down 8.44% thru yesterday. The average spread on a 10 year BBB rated corporate bond increased from 100 basis points to a high of 179 basis points on March 14th. However, corporate bonds have held up well in the recent move downward and spreads have tightened to 145 basis points. Overall Investment Grade corporate balance sheets are stronger since the pandemic, as companies have reduced debt or refinanced debt to extend maturities and lower the overall cost. Recession concerns continue, so we remain selective in corporates emphasizing improving and high-quality credits.
While the year to date returns below look concerning, it also means the yields on bonds are higher today than at the end of 2021. In this highly fluid environment, we recommend avoiding broad based fixed income indices and selecting individual bonds that meet a client’s risk and return needs, preferably actively managed by a dedicated manager.
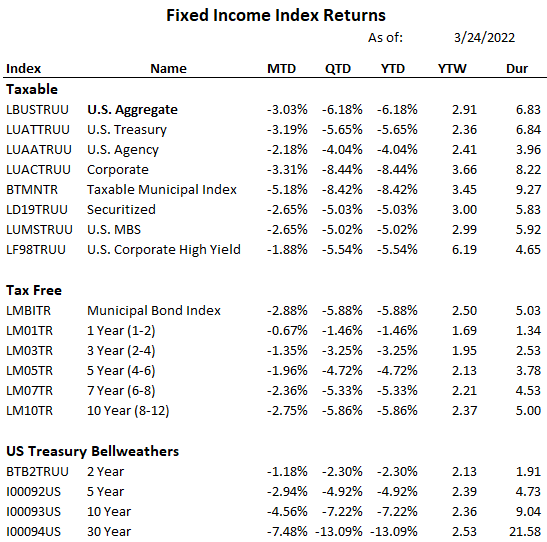
MTD, QTD, YTD: Performance of the index, Month, Quarter or Year to date
YTW: Weighted average Yield to Worst of the index
DUR: Weighted average Duration to Worst of the Index
See disclosures and notes below for additional information.
CME FedWatch Tool
As of: 03/25/2022
Click on the above links for more information on important investment and economic concepts.
Disclosures
Indexes used for Fixed Income Returns
U.S. Aggregate – The Bloomberg US Aggregate Bond Index (Symbol: LBUSTRUU)
U.S. Treasury – The Bloomberg US Treasury Index (Symbol: LUATTRUU)
Corporate – The Bloomberg US Corporate Bond Index (Symbol: LUACTRUU)
U.S. Corporate High Yield – The Bloomberg US Corporate High Yield Bond Index (Symbol: LF98TRUU)
Taxable Municipal Index – The Bloomberg Municipal Index Taxable Bond Index (Symbol: BTMNTR)
Tax-Free Muni Index- The Bloomberg Municipal Bond Index (Symbol: LMBITR)
Tax-Free Muni 7-Yr Index – The Bloomberg Municipal Bond 7 Year (6-8) Index (Symbol: LM07TR)
Indexes used for AAA Municipal Yields
2 Year: BVAL Municipal AAA Yield Curve (Callable) 2 Year (Symbol: CAAA02YR BVLI)
5 Year: BVAL Municipal AAA Yield Curve (Callable) 5 Year (Symbol: CAAA04YR BVLI)
10 Year: BVAL Municipal AAA Yield Curve (Callable) 10 Year (Symbol: CAAA10YR BVLI)
30 Year: BVAL Municipal AAA Yield Curve (Callable) 30 Year (Symbol: CAAA30YR BVLI)
Indexes used for US Treasury Yields
2 Year: US Generic Govt 2 Year Yield (Symbol: USGG2YR)
5 Year: US Generic Govt 5 Year Yield (Symbol: USGG5YR)
10 Year: US Generic Govt 10 Year Yield (Symbol: USGG10YR)
30 Year: US Generic Govt 30 Year Yield (Symbol: USGG30YR)
F/m Investments, LLC, doing business as Genoa Asset Management (Genoa), is an investment advisor registered under the Investment Advisers Act of 1940. Registration as an investment adviser does not imply any level of skill or training. The oral and written communications of an adviser provide you with information about which you determine to hire or retain an adviser. For more information please visit: https://adviserinfo.sec.gov/ and search our firm name. The opinions expressed herein are those of Genoa and may not come to pass. The material is current as of the date of this presentation and is subject to change at any time, based on market and other conditions. The information presented in the material is general in nature and is not designed to address your investment objectives, financial situation or particular needs. Prior to making any investment decision, you should assess, or seek advice from a professional regarding whether any particular transaction is relevant or appropriate to your individual circumstances. The information presented does not involve the rendering of personalized financial, legal or tax advice, but is limited to the dissemination of general information for educational purposes. Please consult financial, legal or tax professionals for specific information regarding your individual situation. This information does not constitute a solicitation or an offer to buy or sell any securities. Although taken from reliable sources, Genoa cannot guarantee the accuracy of the information received from third parties. Charts, diagrams, and graphs, by themselves, cannot be used to make investment decisions. Investing involves risk of loss, including loss of principal. Past performance is no guarantee of future results. An index is a portfolio of specific securities, the performance of which is often used as a benchmark in judging the relative performance of certain asset classes. Indexes are unmanaged portfolios and investors cannot invest directly in an index. An index does not charge management fees or brokerage expenses, and no such fees or expenses were deducted from the performance shown.