Written by Peter Baden, CFA, Chief Investment Officer
Headlines of the Week
Retiring “Transitory”…
Google “Define: Transitory” you get a quick definition: “not permanent”. Fed Chairman Powell stated this is what they meant by “Transitory”. However, scroll down a bit and Merriam-Webster definition is: “of brief duration”. Perhaps it’s understandable that there was some confusion. Perhaps the economists at The Fed were surprised by the level and persistence of inflation in 2021. But we now know, stoking economic demand with low rates and fiscal stimulus checks, while at the same time limiting supply with pandemic related restrictions (shutdowns, travel bans, etc.) is a great way to finally break our cycle of low inflation. The question now? Is this inflation the new normal?
First, just by simple math, be prepared for several more months of headlines of high year over year inflation. The most recent headline CPI index level was 278.88. If we stop inflation for December and get the exact same 278.88, it’s still a 6.6% year over year increase from the December 2020 index of 261.56. If CPI stays 278.88, it would be before May we see a headline YOY inflation figure below 4%.
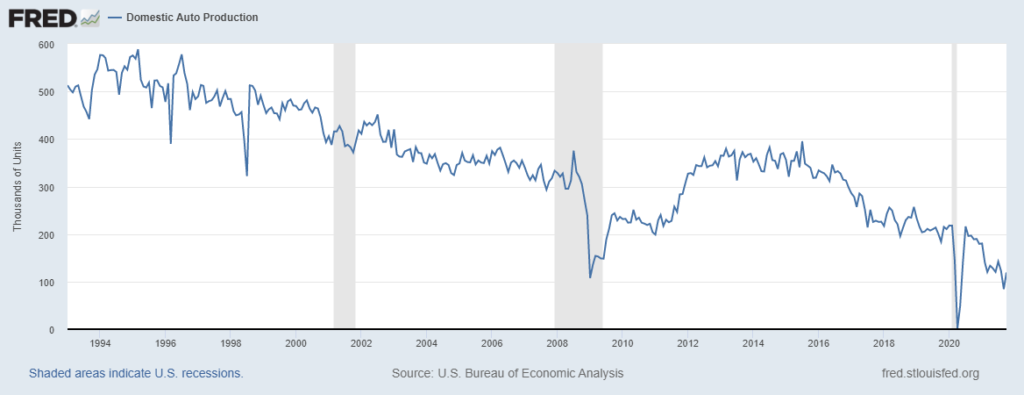
Second, until we see auto production improve (See Below), you can’t expect used car prices to drop. Used cars become junk cars and demand for cars is high (Reopening, Stimulus, Pandemic Related Demand) meaning prices go up as cars become scarce.
But new car production will go up and so will so many other commodity and finished goods items, and when they do, the long-term forces of technology, innovation and improved price discovery should take hold and mitigate future inflation rates.
US Domestic Auto Production
As of: 12/10/2021
Click on the above links for more information on important investment and economic concepts.
Disclosures
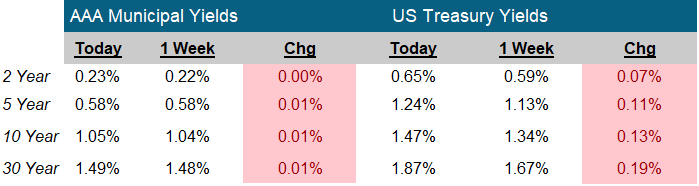
Indexes used for AAA Municipal Yields
2 Year: BVAL Municipal AAA Yield Curve (Callable) 2 Year (Symbol: CAAA02YR BVLI)
5 Year: BVAL Municipal AAA Yield Curve (Callable) 5 Year (Symbol: CAAA04YR BVLI)
10 Year: BVAL Municipal AAA Yield Curve (Callable) 10 Year (Symbol: CAAA10YR BVLI)
30 Year: BVAL Municipal AAA Yield Curve (Callable) 30 Year (Symbol: CAAA30YR BVLI)
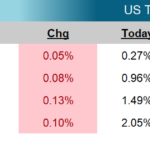
Indexes used for US Treasury Yields
2 Year: US Generic Govt 2 Year Yield (Symbol: USGG2YR)
5 Year: US Generic Govt 5 Year Yield (Symbol: USGG5YR)
10 Year: US Generic Govt 10 Year Yield (Symbol: USGG10YR)
30 Year: US Generic Govt 30 Year Yield (Symbol: USGG30YR) F/m Investments, LLC, doing business as Genoa Asset Management (Genoa), is an investment advisor registered under the Investment Advisers Act of 1940. Registration as an investment adviser does not imply any level of skill or training. The oral and written communications of an adviser provide you with information about which you determine to hire or retain an adviser. For more information please visit: https://adviserinfo.sec.gov/ and search our firm name. The opinions expressed herein are those of Genoa and may not come to pass. The material is current as of the date of this presentation and is subject to change at any time, based on market and other conditions. The information presented in the material is general in nature and is not designed to address your investment objectives, financial situation or particular needs. Prior to making any investment decision, you should assess, or seek advice from a professional regarding whether any particular transaction is relevant or appropriate to your individual circumstances. The information presented does not involve the rendering of personalized financial, legal or tax advice, but is limited to the dissemination of general information for educational purposes. Please consult financial, legal or tax professionals for specific information regarding your individual situation. This information does not constitute a solicitation or an offer to buy or sell any securities. Although taken from reliable sources, Genoa cannot guarantee the accuracy of the information received from third parties. Charts, diagrams, and graphs, by themselves, cannot be used to make investment decisions. Investing involves risk of loss, including loss of principal. Past performance is no guarantee of future results. An index is a portfolio of specific securities, the performance of which is often used as a benchmark in judging the relative performance of certain asset classes. Indexes are unmanaged portfolios and investors cannot invest directly in an index. An index does not charge management fees or brokerage expenses, and no such fees or expenses were deducted from the performance shown.