December 9, 2022
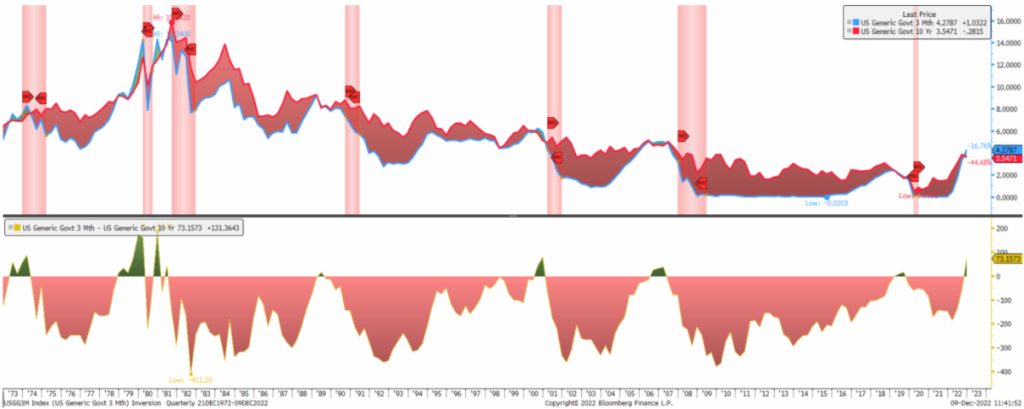
The bond market can be a pretty good forecaster. Looking back over the last 50 years, it’s been very good at forecasting recessions. The track record? Seven for seven. And the crystal ball it uses to do this prediction? The yield curve, specifically an inversion of the yield curve.
The yield curve inverts when short term yields are higher than long term yields, for our discussion we are focused on the three-month US Treasury Bill (Yielding 4.28%) and the ten-year US Treasury Note (Yielding 3.54%). Why would anyone lend money longer and get less return for it? Perhaps you want to lock in higher rates, you might think inflation is going down, or historically the ten-year has been negatively correlated to stocks and a great diversifier for a portfolio.
What makes this inversion unique is the continuation of Fed rate hikes. Looking back fifty years, the curve has predicted all seven of the recessions. Five of those seven times, the Fed left rates unchanged or cut them. The other two times? 1978 and 1980. The seventies the Fed keeps mentioning it learned from, hiking in the face of a recession, and creating a bigger recession.
We will say it again, it’s a great time to be in bonds. While we remain cautious extending into credit, we see opportunities in fixed income without having to take credit risk. Short US Treasury issues have attractive yields and are an excellent place to ride out the coming volatility. We also see good value in longer high-quality tax-free municipals and high grade, liquid corporates where yields are attractive, and rates should be stable.
Use this recovery in the market to reposition portfolios to reduce risk, increase liquidity and prepare for the fallout from the 2022 rate increases. When the turmoil comes, you will have plenty of liquid bonds (Potentially with some gains) to sell and reposition into cheaper risk assets.
-Peter Baden, CFA
Chief Investment Officer
Click on the above links for more information on important investment and economic concepts.
Yield Curve Inversion
Generic 10 Year Yield less the Generic 3 Month Yield
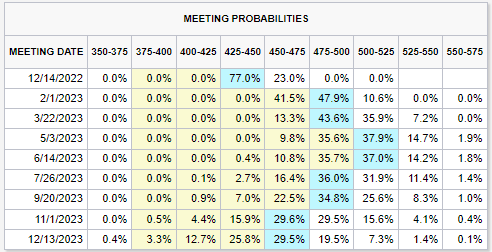
CME Fed Watch Tool
Click on the above links for more information on important investment and economic concepts.
Contact Genoa Asset Management
William (Kip) Weese
SVP, Intermediary Sales
Northeast & South West
(508) 423-2269
Email Kip
Art Blackman
VP, Intermediary Sales
Central
(816) 688-8482
Email Art
Rick Bell
VP, Intermediary Sales
North Central & North West
(513) 762-3694
Email Rick
Disclosures
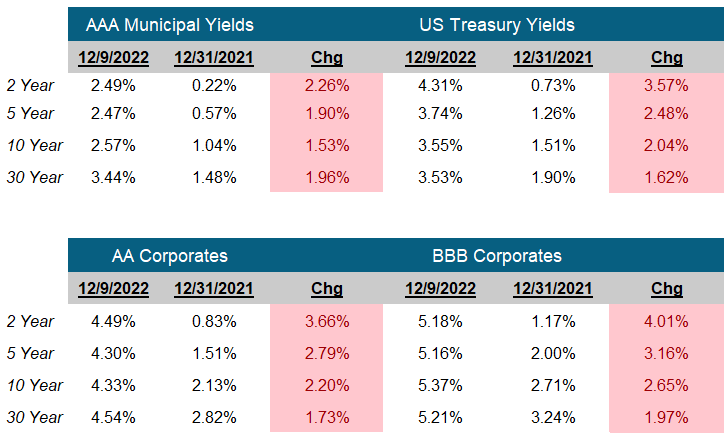
Indexes used for AAA Municipal Yields
2 Year: BVAL Municipal AAA Yield Curve (Callable) 2 Year (Symbol: CAAA02YR BVLI)
5 Year: BVAL Municipal AAA Yield Curve (Callable) 5 Year (Symbol: CAAA04YR BVLI)
10 Year: BVAL Municipal AAA Yield Curve (Callable) 10 Year (Symbol: CAAA10YR BVLI)
30 Year: BVAL Municipal AAA Yield Curve (Callable) 30 Year (Symbol: CAAA30YR BVLI)
Indexes used for US Treasury Yields
2 Year: US Generic Govt 2 Year Yield (Symbol: USGG2YR)
5 Year: US Generic Govt 5 Year Yield (Symbol: USGG5YR)
10 Year: US Generic Govt 10 Year Yield (Symbol: USGG10YR)
30 Year: US Generic Govt 30 Year Yield (Symbol: USGG30YR)
F/m Investments, LLC, doing business as Genoa Asset Management (Genoa), is an investment advisor registered under the Investment Advisers Act of 1940. Registration as an investment adviser does not imply any level of skill or training. The oral and written communications of an adviser provide you with information about which you determine to hire or retain an adviser. For more information please visit: https://adviserinfo.sec.gov/ and search our firm name. The opinions expressed herein are those of Genoa and may not come to pass. The material is current as of the date of this presentation and is subject to change at any time, based on market and other conditions. The information presented in the material is general in nature and is not designed to address your investment objectives, financial situation or particular needs. Prior to making any investment decision, you should assess, or seek advice from a professional regarding whether any particular transaction is relevant or appropriate to your individual circumstances. The information presented does not involve the rendering of personalized financial, legal or tax advice, but is limited to the dissemination of general information for educational purposes. Please consult financial, legal or tax professionals for specific information regarding your individual situation. This information does not constitute a solicitation or an offer to buy or sell any securities. Although taken from reliable sources, Genoa cannot guarantee the accuracy of the information received from third parties. Charts, diagrams, and graphs, by themselves, cannot be used to make investment decisions. Investing involves risk of loss, including loss of principal. Past performance is no guarantee of future results. An index is a portfolio of specific securities, the performance of which is often used as a benchmark in judging the relative performance of certain asset classes. Indexes are unmanaged portfolios and investors cannot invest directly in an index. An index does not charge management fees or brokerage expenses, and no such fees or expenses were deducted from the performance shown.