April 22, 2022
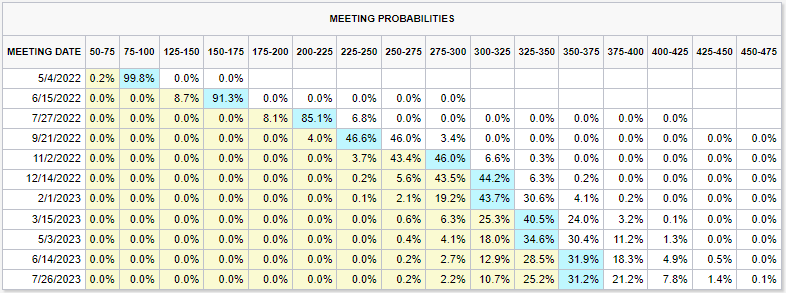
It’s been a dreary time in bond land. It seems every day the market just grinds continually lower, wearing on minds, emotions, and portfolios. This was supposed to be the capital preservation part of the portfolio, right? And didn’t the Fed just start raising rates? If we believe the futures market, we can expect increases at each of the Fed meetings this year and a few next year, perhaps as much as 75 basis points! (See Below) Is this just the beginning of the bad news?
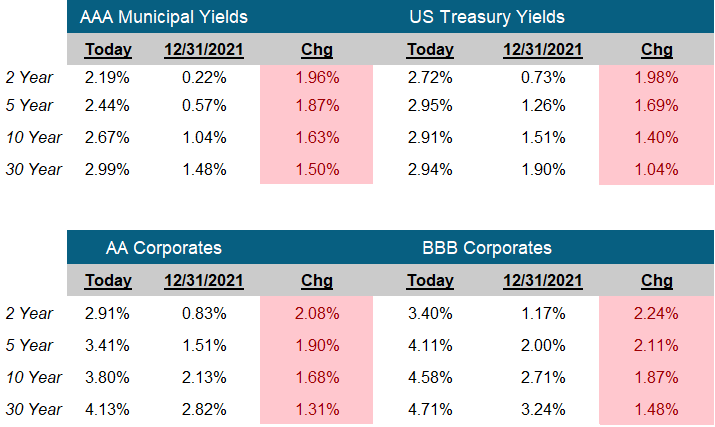
We don’t think so. Through their various news releases, speeches and news conferences, The Fed has telegraphed their intentions through an impressive shock and awe campaign. With each of these revelations, bond prices have traded off raising interest rates, and doing a lot of the Fed’s work for them. Since the lows on August 3, 2021, the yields on the 10- and 2-year US Treasuries are up 172 and 254 basis points respectively.
Looking forward we see three potential scenarios for the rates and the economy (In order of most likely to least likely):
Scenario 1: Inflation is peaking, and we will see a slow decline from these high levels. Given that the Fed’s efforts worked they can slow the rate of increases and perhaps there won’t be a recession. If that happens, short rates could stabilize around these levels and long rates could decline over time. With the risk of a recession reduced, corporate and municipal spreads could tighten.
Scenario 2: Inflation hasn’t peaked, the Fed continues to raise rates and causes a recession. With the advent of the recession, inflation declines. In this scenario we could see short rates continue to increase. Long rates could also increase but would peak and decrease as the recession takes hold. Corporate and municipal spreads would widen on recession fears.
Scenario 3: Inflation hasn’t peaked, the Fed continues to raise rates, causes a recession and inflation doesn’t decline. This is called Stagflation. In this scenario, short and long rates will go higher as the Fed chases continued hot inflation. Corporate and municipal spreads would widen on recession fears.
The Fed is set upon a historic path. It’s possible that their guiding of the market rates higher and front-loading rate increases might be able to mitigate the inflation rate without causing a recession. It’s also possible they cause a recession, which would likely reduce the rate of inflation. But a return to 1970’s style stagflation, while possible, is not likely. The deflationary forces of technology and innovation should help mitigate long term inflationary pressures.
-Peter Baden, CFA
Chief Investment Officer
Click on the above links for more information on important investment and economic concepts.
CME Fed Watch Tool
https://www.cmegroup.com/trading/interest-rates/countdown-to-fomc.html
Contact Genoa Asset Management
William (Kip) Weese
SVP, Intermediary Sales
Northeast & South West
(508) 423-2269
Email Kip
Art Blackman
VP, Intermediary Sales
Central
(816) 688-8482
Email Art
Rick Bell
VP, Intermediary Sales
North Central & North West
(513) 762-3694
Email Rick
Disclosures
Indexes used for Fixed Income Returns
U.S. Aggregate – The Bloomberg US Aggregate Bond Index (Symbol: LBUSTRUU)
U.S. Treasury – The Bloomberg US Treasury Index (Symbol: LUATTRUU)
Corporate – The Bloomberg US Corporate Bond Index (Symbol: LUACTRUU)
U.S. Corporate High Yield – The Bloomberg US Corporate High Yield Bond Index (Symbol: LF98TRUU)
Taxable Municipal Index – The Bloomberg Municipal Index Taxable Bond Index (Symbol: BTMNTR)
Tax-Free Muni Index- The Bloomberg Municipal Bond Index (Symbol: LMBITR)
Tax-Free Muni 7-Yr Index – The Bloomberg Municipal Bond 7 Year (6-8) Index (Symbol: LM07TR)
Indexes used for AAA Municipal Yields
2 Year: BVAL Municipal AAA Yield Curve (Callable) 2 Year (Symbol: CAAA02YR BVLI)
5 Year: BVAL Municipal AAA Yield Curve (Callable) 5 Year (Symbol: CAAA04YR BVLI)
10 Year: BVAL Municipal AAA Yield Curve (Callable) 10 Year (Symbol: CAAA10YR BVLI)
30 Year: BVAL Municipal AAA Yield Curve (Callable) 30 Year (Symbol: CAAA30YR BVLI)
Indexes used for US Treasury Yields
2 Year: US Generic Govt 2 Year Yield (Symbol: USGG2YR)
5 Year: US Generic Govt 5 Year Yield (Symbol: USGG5YR)
10 Year: US Generic Govt 10 Year Yield (Symbol: USGG10YR)
30 Year: US Generic Govt 30 Year Yield (Symbol: USGG30YR)
F/m Investments, LLC, doing business as Genoa Asset Management (Genoa), is an investment advisor registered under the Investment Advisers Act of 1940. Registration as an investment adviser does not imply any level of skill or training. The oral and written communications of an adviser provide you with information about which you determine to hire or retain an adviser. For more information please visit: https://adviserinfo.sec.gov/ and search our firm name. The opinions expressed herein are those of Genoa and may not come to pass. The material is current as of the date of this presentation and is subject to change at any time, based on market and other conditions. The information presented in the material is general in nature and is not designed to address your investment objectives, financial situation or particular needs. Prior to making any investment decision, you should assess, or seek advice from a professional regarding whether any particular transaction is relevant or appropriate to your individual circumstances. The information presented does not involve the rendering of personalized financial, legal or tax advice, but is limited to the dissemination of general information for educational purposes. Please consult financial, legal or tax professionals for specific information regarding your individual situation. This information does not constitute a solicitation or an offer to buy or sell any securities. Although taken from reliable sources, Genoa cannot guarantee the accuracy of the information received from third parties. Charts, diagrams, and graphs, by themselves, cannot be used to make investment decisions. Investing involves risk of loss, including loss of principal. Past performance is no guarantee of future results. An index is a portfolio of specific securities, the performance of which is often used as a benchmark in judging the relative performance of certain asset classes. Indexes are unmanaged portfolios and investors cannot invest directly in an index. An index does not charge management fees or brokerage expenses, and no such fees or expenses were deducted from the performance shown.