April 29, 2022
As we mentioned last week, over the next year, we think there are three scenarios for the economy and the fixed income market. All three scenarios hinge on the trajectory of inflation. Inflation is either going to peak and cool off, or it’s not peaking or cooling off. If it’s the former, the Fed might be able to avoid a recession by not raising rates beyond the “Neutral” rate (A theoretical overnight fed funds rate that supports economic growth without an inflationary overheat). If it’s the latter, The Fed will keep raising interest rates until the inflationary forces in the economy are exhausted, also known as a recession.
This week we got some bad readings on inflation. The Fed’s favorite measure for inflation, the PCE Deflator came in at 6.6% (The highest since 1982). And while the GDP report showed a quarter over quarter contraction of -1.4%, the consumer spending portion of the index remains strong, growing 2.3%. Friday, the Employment Cost Index was released showing wages for all civilians increased 4.5% year over year. This increase happened even as nonfarm payrolls gains have been outsized and labor shortages have eased as more workers rejoin the workforce. This combination suggests demand for labor still exceeds supply by a sizable margin.
Fed Chair Jerome Powell captures the essence of the current labor market when he says it’s “too hot.” As more readings are released, showing more evidence of inflation, the prospect of the Fed achieving a soft landing gets dimmer.
Fed Chair Jerome Powell captures the essence of the current labor market when he says it’s “too hot.” As more readings are released, showing more evidence of inflation, the prospect of the Fed achieving a soft landing gets dimmer.
-Peter Baden, CFA
Chief Investment Officer
Click on the above links for more information on important investment and economic concepts.
CME Fed Watch Tool
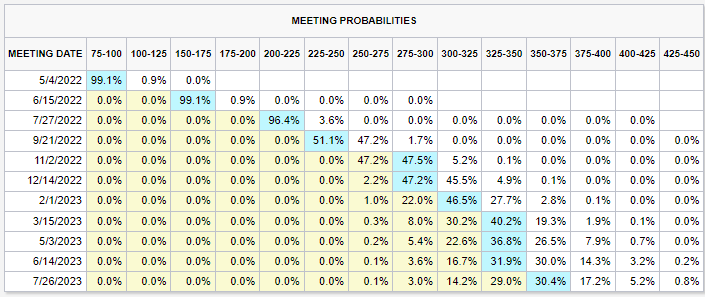
https://www.cmegroup.com/trading/interest-rates/countdown-to-fomc.html
Contact Genoa Asset Management
William (Kip) Weese
SVP, Intermediary Sales
Northeast & South West
(508) 423-2269
Email Kip
Art Blackman
VP, Intermediary Sales
Central
(816) 688-8482
Email Art
Rick Bell
VP, Intermediary Sales
North Central & North West
(513) 762-3694
Email Rick
Disclosures
Indexes used for Fixed Income Returns
U.S. Aggregate – The Bloomberg US Aggregate Bond Index (Symbol: LBUSTRUU)
U.S. Treasury – The Bloomberg US Treasury Index (Symbol: LUATTRUU)
Corporate – The Bloomberg US Corporate Bond Index (Symbol: LUACTRUU)
U.S. Corporate High Yield – The Bloomberg US Corporate High Yield Bond Index (Symbol: LF98TRUU)
Taxable Municipal Index – The Bloomberg Municipal Index Taxable Bond Index (Symbol: BTMNTR)
Tax-Free Muni Index- The Bloomberg Municipal Bond Index (Symbol: LMBITR)
Tax-Free Muni 7-Yr Index – The Bloomberg Municipal Bond 7 Year (6-8) Index (Symbol: LM07TR)
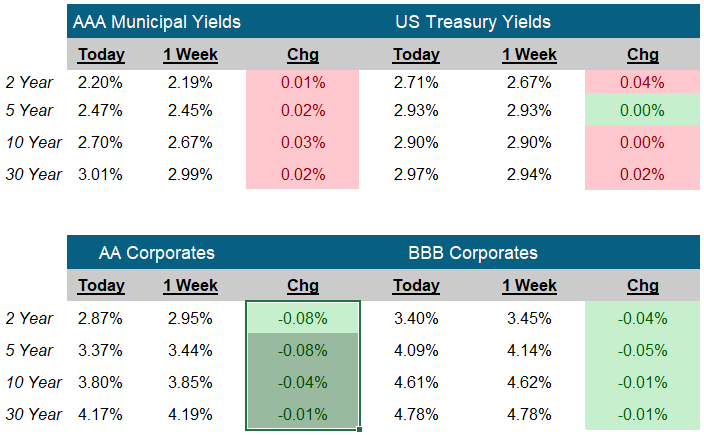
Indexes used for AAA Municipal Yields
2 Year: BVAL Municipal AAA Yield Curve (Callable) 2 Year (Symbol: CAAA02YR BVLI)
5 Year: BVAL Municipal AAA Yield Curve (Callable) 5 Year (Symbol: CAAA04YR BVLI)
10 Year: BVAL Municipal AAA Yield Curve (Callable) 10 Year (Symbol: CAAA10YR BVLI)
30 Year: BVAL Municipal AAA Yield Curve (Callable) 30 Year (Symbol: CAAA30YR BVLI)
Indexes used for US Treasury Yields
2 Year: US Generic Govt 2 Year Yield (Symbol: USGG2YR)
5 Year: US Generic Govt 5 Year Yield (Symbol: USGG5YR)
10 Year: US Generic Govt 10 Year Yield (Symbol: USGG10YR)
30 Year: US Generic Govt 30 Year Yield (Symbol: USGG30YR)
F/m Investments, LLC, doing business as Genoa Asset Management (Genoa), is an investment advisor registered under the Investment Advisers Act of 1940. Registration as an investment adviser does not imply any level of skill or training. The oral and written communications of an adviser provide you with information about which you determine to hire or retain an adviser. For more information please visit: https://adviserinfo.sec.gov/ and search our firm name. The opinions expressed herein are those of Genoa and may not come to pass. The material is current as of the date of this presentation and is subject to change at any time, based on market and other conditions. The information presented in the material is general in nature and is not designed to address your investment objectives, financial situation or particular needs. Prior to making any investment decision, you should assess, or seek advice from a professional regarding whether any particular transaction is relevant or appropriate to your individual circumstances. The information presented does not involve the rendering of personalized financial, legal or tax advice, but is limited to the dissemination of general information for educational purposes. Please consult financial, legal or tax professionals for specific information regarding your individual situation. This information does not constitute a solicitation or an offer to buy or sell any securities. Although taken from reliable sources, Genoa cannot guarantee the accuracy of the information received from third parties. Charts, diagrams, and graphs, by themselves, cannot be used to make investment decisions. Investing involves risk of loss, including loss of principal. Past performance is no guarantee of future results. An index is a portfolio of specific securities, the performance of which is often used as a benchmark in judging the relative performance of certain asset classes. Indexes are unmanaged portfolios and investors cannot invest directly in an index. An index does not charge management fees or brokerage expenses, and no such fees or expenses were deducted from the performance shown.