Written by Peter Baden, CFA, Chief Investment Officer
Sector Review
With the Fed tapering and entering a new phase of the rate cycle, we anticipate increased volatility in the markets. With volatility comes opportunity to pick up bonds at good prices and improve our portfolios. We continue to like municipal bonds, improving corporate credits and select preferred stocks.
Treasuries
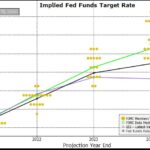
- With the Fed signaling three 25 basis point increases in 2022 (and potentially 3 more in 2023) yields on the short end of the curve rose, while low worldwide rates and a recently hawkish tone at the Fed kept long term rates range bound, producing a negative year for Treasuries.
- Inflation will continue to pressure rates (and policy makers) as headline inflation will continue to print 5-6% increases through May and likely June.
- There is some opportunity in the now steep front end of the curve with almost 30 bps of roll down from the 3 year to the 2 year.
Municipals
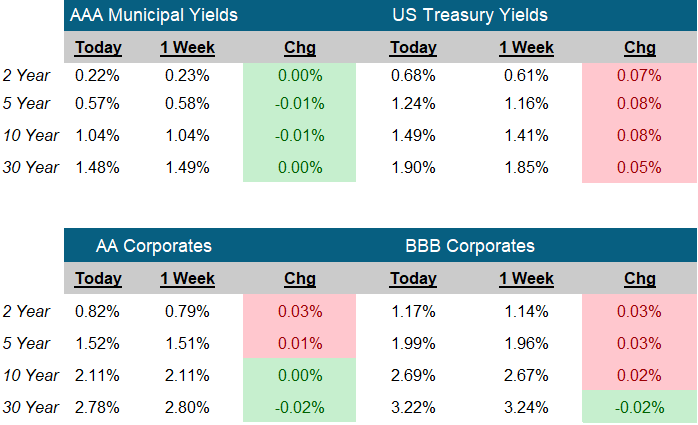
- Strong demand from individual and institutional investors throughout the year kept the municipal market on pace with US Treasuries. We believe municipals should continue to be strong if the current Administration follows through on the pledge to raise taxes on our wealthiest individuals.
- Overall credit quality has improved for the municipal market as tax revenues, especially sales tax revenues, increased this year over 2020. Additionally, Federal stimulus funds received shored up the weaker cities and states, and improved the balance sheets of many already strong municipalities.
- The recent Infrastructure bill passed in Congress has started to trickle down to the states. This will bring much needed improvements to our roads and bridges that will be financed with a fresh supply of municipal new issues
Corporates
- BBB credit Spreads tightened for the first half of the year as the pandemic receded and companies adapted and flourished in the new normal. Variants raged, inflation spiked, and Treasury yields fell causing the spreads to widen
- The long-term chart of the 10-year BBB credit spread below indicates spreads are still tight. Spreads could continue to widen. Corporate debt has risen significantly, defaults are at all-time lows and rising Treasury rates could draw flows into less risky sectors.
- We continue to find value in moderate and improving credits and those bonds that will benefit from rising rates.
Preferred Stocks
- High yields and a high correlation with common stocks provided a good year for preferred stocks.
- Supply has increased and given the demand for yield, quality has decreased setting up a tough year ahead.
- With the Fed tapering and signaling rate increases, we expect volatility to increase in preferred stocks.
- We continue to focus on good quality $25 par value bonds and issues convertible into common stock that produce good cash flow.
Don’t miss our 2022 Outlook. Click the link below:
Happy Holidays! We wish you all the best in the New Year!
BBB 10-Year Credit Spread
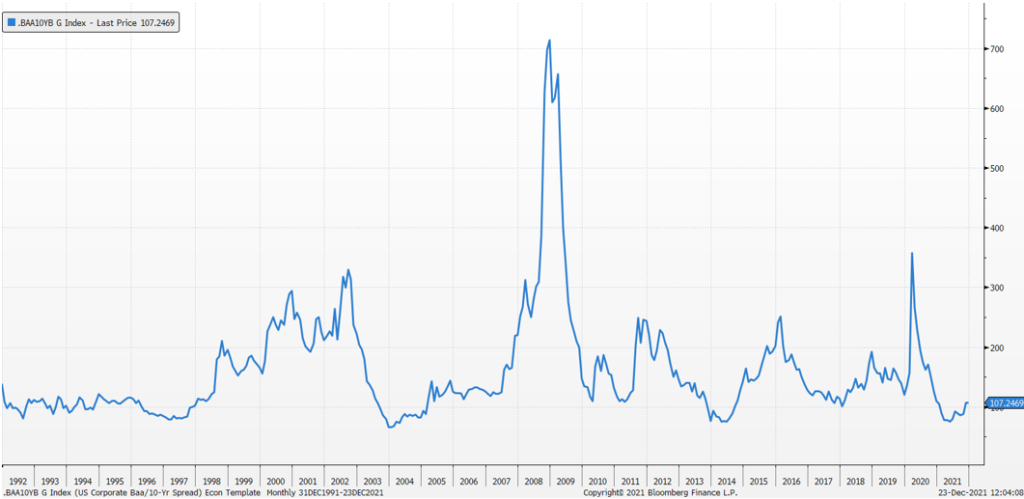
Source: Bloomberg Calculated taking the yield to worst of the 10 year Baa index and subtracting the yield to maturity of the 10 year treasury
Click on the above links for more information on important investment and economic concepts.
Disclosures
Indexes used for AAA Municipal Yields
2 Year: BVAL Municipal AAA Yield Curve (Callable) 2 Year (Symbol: CAAA02YR BVLI)
5 Year: BVAL Municipal AAA Yield Curve (Callable) 5 Year (Symbol: CAAA04YR BVLI)
10 Year: BVAL Municipal AAA Yield Curve (Callable) 10 Year (Symbol: CAAA10YR BVLI)
30 Year: BVAL Municipal AAA Yield Curve (Callable) 30 Year (Symbol: CAAA30YR BVLI)
Indexes used for US Treasury Yields
2 Year: US Generic Govt 2 Year Yield (Symbol: USGG2YR)
5 Year: US Generic Govt 5 Year Yield (Symbol: USGG5YR)
10 Year: US Generic Govt 10 Year Yield (Symbol: USGG10YR)
30 Year: US Generic Govt 30 Year Yield (Symbol: USGG30YR) F/m Investments, LLC, doing business as Genoa Asset Management (Genoa), is an investment advisor registered under the Investment Advisers Act of 1940. Registration as an investment adviser does not imply any level of skill or training. The oral and written communications of an adviser provide you with information about which you determine to hire or retain an adviser. For more information please visit: https://adviserinfo.sec.gov/ and search our firm name. The opinions expressed herein are those of Genoa and may not come to pass. The material is current as of the date of this presentation and is subject to change at any time, based on market and other conditions. The information presented in the material is general in nature and is not designed to address your investment objectives, financial situation or particular needs. Prior to making any investment decision, you should assess, or seek advice from a professional regarding whether any particular transaction is relevant or appropriate to your individual circumstances. The information presented does not involve the rendering of personalized financial, legal or tax advice, but is limited to the dissemination of general information for educational purposes. Please consult financial, legal or tax professionals for specific information regarding your individual situation. This information does not constitute a solicitation or an offer to buy or sell any securities. Although taken from reliable sources, Genoa cannot guarantee the accuracy of the information received from third parties. Charts, diagrams, and graphs, by themselves, cannot be used to make investment decisions. Investing involves risk of loss, including loss of principal. Past performance is no guarantee of future results. An index is a portfolio of specific securities, the performance of which is often used as a benchmark in judging the relative performance of certain asset classes. Indexes are unmanaged portfolios and investors cannot invest directly in an index. An index does not charge management fees or brokerage expenses, and no such fees or expenses were deducted from the performance shown.