Written by Peter Baden, CFA, Chief Investment Officer
Headlines of the Week
“Life is so Uncertain” – Lyle Lovett “Hear I Am”
Turning points in the market produce plenty of uncertainty and with it volatility. Let’s review, a few months ago the Fed was keeping rates low, buying bonds, and not looking to change things in the near term. Now the Fed Governor is talking tough, and all tools are on the table, no matter the market reaction. As we said in our update last week:
- Strong, determined language backed by resolute action will reinforce confidence in the Fed and perhaps slow down the rate of inflation later this year. – Interest Rate Update 1-21-22
So where do we go from here? At Genoa, we regularly run an exercise to address uncertainty and uncover opportunity in change. Roughly based on the Johari Window, but focused on what we know, what we believe, what the market believes and what we don’t know.
For example, some things We Know: The Fed have seven more meetings this year, and we know the dates of each meeting. We also know there will be a US mid-term election in November. The list can go on but here are some things we believe: The Fed will only increase the Overnight Fed Fund rates after a meeting. They have raised the Fed Funds rate outside of meeting dates before, but we believe they will stick to meeting dates this time. We also believe they will increase the rate multiple times in 2022. The Chairman was quite clear about the need for action and that the Overnight Fed Funds Rate is their primary tool. We also believe bond purchases will end in March, and quantitative tightening (Shrinking the Balance Sheet), will start sometime this year, but we don’t have any guidance around that.
How do we tell what the market believes? Below is one tool we have shared before and utilize regularly, the CME Fed Watch Tool. There are other indicators in the market, the yield curve, and TIPs versus treasuries are also helpful. Consensus estimates, and commentaries like this one are also helpful to gauge forecasts and belief in those forecasts (But you knew that already, because you’re reading this!)
What don’t we know? The list is long, but we make the list, so we can label them and perhaps move them to the believe section sometime in the future. For instance, we don’t know what the Fed funds rate will be at year end. We can move this to a believe if we use a forecast of between 1.00 – 1.75%, knowing there might be changes to that forecast.
By going through this exercise, we can identify what we know, what we believe, what the market believes, and what we don’t know, and with that we reduce our uncertainty and enable ourselves to take advantage of volatility in the market and the opportunities it presents.
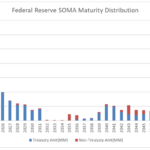
So how does this translate into portfolios? We talk about a Bar-Bell structure for bond portfolios. At Genoa we manage individual bonds, so we can have a portion of the bonds maturing as the Fed is increasing rates, ready to be invested at potentially higher rates. We can invest another portion of the portfolio maturing longer, earning higher yields, and potentially benefiting from the Fed successfully slowing inflation. In between those allocations, we might pick a few select ideas that have outstanding total return potential. We believe this portfolio structure might outperform as interest rates rise. And while that is uncertain, we know we have a plan and that also reduces our uncertainty.
CME FedWatch Tool
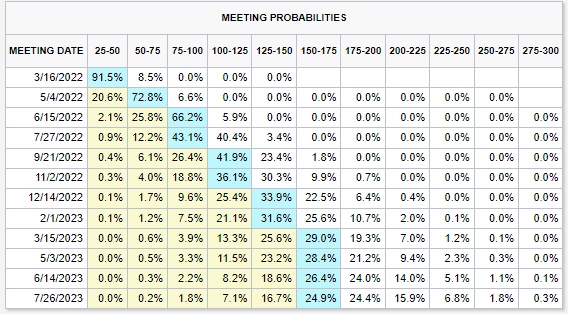
As of: 01/28/2022
Click on the above links for more information on important investment and economic concepts.
Disclosures
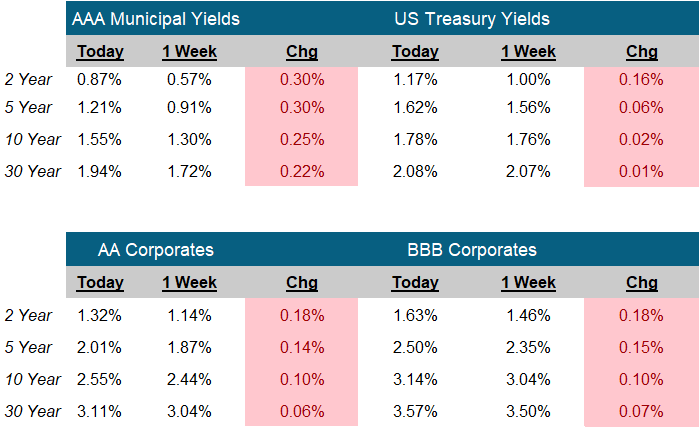
Indexes used for AAA Municipal Yields
2 Year: BVAL Municipal AAA Yield Curve (Callable) 2 Year (Symbol: CAAA02YR BVLI)
5 Year: BVAL Municipal AAA Yield Curve (Callable) 5 Year (Symbol: CAAA04YR BVLI)
10 Year: BVAL Municipal AAA Yield Curve (Callable) 10 Year (Symbol: CAAA10YR BVLI)
30 Year: BVAL Municipal AAA Yield Curve (Callable) 30 Year (Symbol: CAAA30YR BVLI)
Indexes used for US Treasury Yields
2 Year: US Generic Govt 2 Year Yield (Symbol: USGG2YR)
5 Year: US Generic Govt 5 Year Yield (Symbol: USGG5YR)
10 Year: US Generic Govt 10 Year Yield (Symbol: USGG10YR)
30 Year: US Generic Govt 30 Year Yield (Symbol: USGG30YR) F/m Investments, LLC, doing business as Genoa Asset Management (Genoa), is an investment advisor registered under the Investment Advisers Act of 1940. Registration as an investment adviser does not imply any level of skill or training. The oral and written communications of an adviser provide you with information about which you determine to hire or retain an adviser. For more information please visit: https://adviserinfo.sec.gov/ and search our firm name. The opinions expressed herein are those of Genoa and may not come to pass. The material is current as of the date of this presentation and is subject to change at any time, based on market and other conditions. The information presented in the material is general in nature and is not designed to address your investment objectives, financial situation or particular needs. Prior to making any investment decision, you should assess, or seek advice from a professional regarding whether any particular transaction is relevant or appropriate to your individual circumstances. The information presented does not involve the rendering of personalized financial, legal or tax advice, but is limited to the dissemination of general information for educational purposes. Please consult financial, legal or tax professionals for specific information regarding your individual situation. This information does not constitute a solicitation or an offer to buy or sell any securities. Although taken from reliable sources, Genoa cannot guarantee the accuracy of the information received from third parties. Charts, diagrams, and graphs, by themselves, cannot be used to make investment decisions. Investing involves risk of loss, including loss of principal. Past performance is no guarantee of future results. An index is a portfolio of specific securities, the performance of which is often used as a benchmark in judging the relative performance of certain asset classes. Indexes are unmanaged portfolios and investors cannot invest directly in an index. An index does not charge management fees or brokerage expenses, and no such fees or expenses were deducted from the performance shown.