Written by Sarah Conwell, Portfolio Manager
Headlines of the Week
- Fed’s Powell to Give Virtual Remarks at Jackson Hole Gathering
- Biggest Tax Hike on Wealthy Since ‘93 Is Bogged Down in U.S. Congress
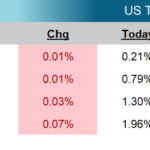
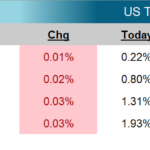
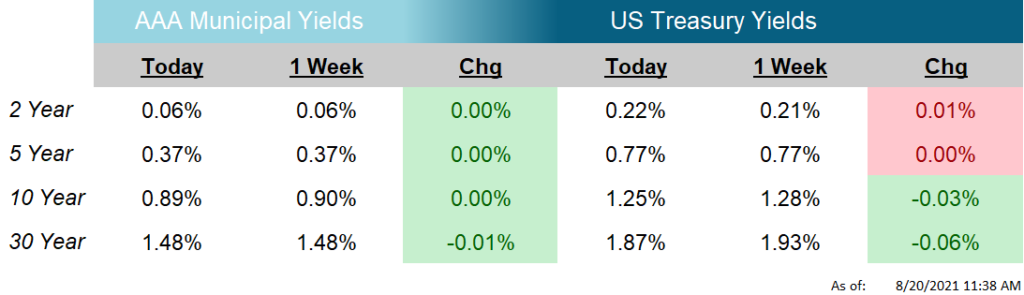
The US Treasury yield curve bull flattened in the week as investors and analysts tempered their expectations for near-term growth in the United States following the apparent resurgence of Covid-19, vis-à-vis the Delta variant.
Retail Sales, released on Tuesday, fell short of expectations and came in at a -1.1% decline in July. When factoring in the current rates of inflation, real spending fell an even greater amount. The largest impact on sales came from the auto sector, with demand outpacing supply and the subsequent increase in prices taking their toll on auto sales as a whole (Retail Sales excluding autos fell -0.4%). Interestingly, there was a 1.4% increase in manufacturing production in the month and a remarkable 11.2% increase in auto output was included in that increase. At this point, it appears supply can’t hardly keep up with demand in the sector.
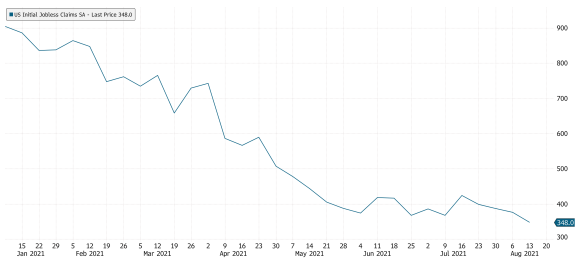
Initial Jobless Claims fell again this week and now stand at 348k, the lowest print since March of 2020. As you can see in this week’s Chart of the Week, claims have been on a steady decline of late after moderating early on in the recovery. With the Federal Reserve’s dual mandate of full employment and stable prices, the improvement in jobless claims is an encouraging sign for the overall health of the economy.
Next week, the Markit PMI is released on Monday, Durable Goods on Wednesday, GDP and PCE on Thursday, and the PCE Deflator will be released on Friday.
Chart of the Week
Source: Bloomberg, LLC
As of: 8/20/2021
Click on the above links for more information on important investment and economic concepts.
Disclosures
Indexes used for AAA Municipal Yields
2 Year: BVAL Municipal AAA Yield Curve (Callable) 2 Year (Symbol: CAAA02YR BVLI)
5 Year: BVAL Municipal AAA Yield Curve (Callable) 5 Year (Symbol: CAAA04YR BVLI)
10 Year: BVAL Municipal AAA Yield Curve (Callable) 10 Year (Symbol: CAAA10YR BVLI)
30 Year: BVAL Municipal AAA Yield Curve (Callable) 30 Year (Symbol: CAAA30YR BVLI)
Indexes used for US Treasury Yields
2 Year: US Generic Govt 2 Year Yield (Symbol: USGG2YR)
5 Year: US Generic Govt 5 Year Yield (Symbol: USGG5YR)
10 Year: US Generic Govt 10 Year Yield (Symbol: USGG10YR)
30 Year: US Generic Govt 30 Year Yield (Symbol: USGG30YR) F/m Investments, LLC, doing business as Genoa Asset Management (Genoa), is an investment advisor registered under the Investment Advisers Act of 1940. Registration as an investment adviser does not imply any level of skill or training. The oral and written communications of an adviser provide you with information about which you determine to hire or retain an adviser. For more information please visit: https://adviserinfo.sec.gov/ and search our firm name. The opinions expressed herein are those of Genoa and may not come to pass. The material is current as of the date of this presentation and is subject to change at any time, based on market and other conditions. The information presented in the material is general in nature and is not designed to address your investment objectives, financial situation or particular needs. Prior to making any investment decision, you should assess, or seek advice from a professional regarding whether any particular transaction is relevant or appropriate to your individual circumstances. The information presented does not involve the rendering of personalized financial, legal or tax advice, but is limited to the dissemination of general information for educational purposes. Please consult financial, legal or tax professionals for specific information regarding your individual situation. This information does not constitute a solicitation or an offer to buy or sell any securities. Although taken from reliable sources, Genoa cannot guarantee the accuracy of the information received from third parties. Charts, diagrams, and graphs, by themselves, cannot be used to make investment decisions. Investing involves risk of loss, including loss of principal. Past performance is no guarantee of future results. An index is a portfolio of specific securities, the performance of which is often used as a benchmark in judging the relative performance of certain asset classes. Indexes are unmanaged portfolios and investors cannot invest directly in an index. An index does not charge management fees or brokerage expenses, and no such fees or expenses were deducted from the performance shown.