Written by Sarah Conwell, Portfolio Manager
Headlines of the Week
- Where Ida stands among the worst hurricanes to hit Louisiana
- Joe Manchin says he will oppose a $3.5 trillion budget bill
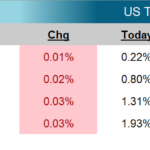
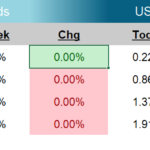
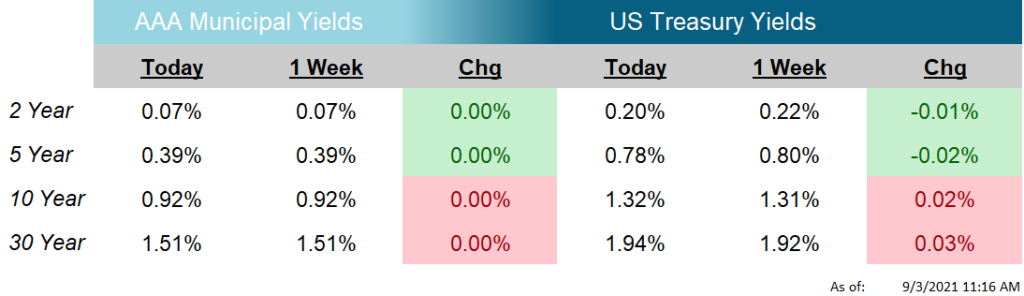
The US Treasury yield curve barely budged in the week, even when considering the increase in long-term yields that materialized after today’s disappointing jobs report.
On Tuesday, the Conference Board Consumer Confidence Index tumbled to 113.8 from 125.1 and versus expectations of 123.0. After 6 consecutive months of increasing confidence levels (January to June of this year), the index has now declined in the last two readings and is back to levels last seen in February 2021. The Present Situation sub-index and the Expectations sub-index both fell precipitously from their previous reading; consumers are becoming more tepid with the recent surge in Delta variant cases and the resumed uncertainty this wave will have on the overall economy.
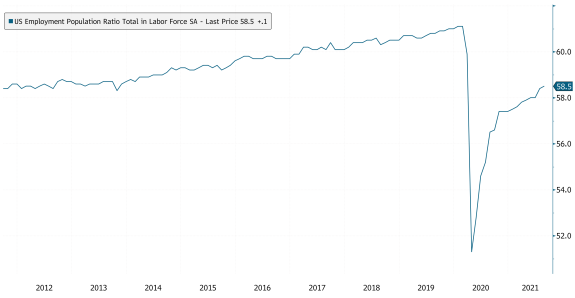
Today’s payroll data made a splash when the Change in Nonfarm Payrolls in August increased only 235k, versus expectations of 733k and an upwardly revised prior print of 1,053k. The seasonality factor, teachers returning to school early (i.e. being counted already last month), and the Delta variant are likely to be the main determinants of this lackluster print. Also reported today, the Unemployment Rate declined 0.2% to 5.2%, as expected, with employment rising more than 500k and the labor force increasing only 190k. The Labor Force Participation Rate has remained near its stubbornly low levels, currently at 61.7%, and the Fed will likely want to see a tick up in this figure in order to put the taper discussion at the forefront of policy at their next meeting. This week’s Chart of the Week graphs the US Employment to Population Ratio and illustrates the slight but gradual improvement we have seen in this figure. August’s reading increased 0.1% from July and is up 1% since the beginning of the year.
Next week will be a shortened week with the market closed for Labor Day on Monday. After that, a light economic week, as Initial Jobless Claims are released on Thursday (as they are every Thursday) and Producer Prices on Friday. Enjoy the long weekend!
Chart of the Week
Source: Bloomberg, LP
As of: 9/3/2021
Click on the above links for more information on important investment and economic concepts.
Disclosures
Indexes used for AAA Municipal Yields
2 Year: BVAL Municipal AAA Yield Curve (Callable) 2 Year (Symbol: CAAA02YR BVLI)
5 Year: BVAL Municipal AAA Yield Curve (Callable) 5 Year (Symbol: CAAA04YR BVLI)
10 Year: BVAL Municipal AAA Yield Curve (Callable) 10 Year (Symbol: CAAA10YR BVLI)
30 Year: BVAL Municipal AAA Yield Curve (Callable) 30 Year (Symbol: CAAA30YR BVLI)
Indexes used for US Treasury Yields
2 Year: US Generic Govt 2 Year Yield (Symbol: USGG2YR)
5 Year: US Generic Govt 5 Year Yield (Symbol: USGG5YR)
10 Year: US Generic Govt 10 Year Yield (Symbol: USGG10YR)
30 Year: US Generic Govt 30 Year Yield (Symbol: USGG30YR) F/m Investments, LLC, doing business as Genoa Asset Management (Genoa), is an investment advisor registered under the Investment Advisers Act of 1940. Registration as an investment adviser does not imply any level of skill or training. The oral and written communications of an adviser provide you with information about which you determine to hire or retain an adviser. For more information please visit: https://adviserinfo.sec.gov/ and search our firm name. The opinions expressed herein are those of Genoa and may not come to pass. The material is current as of the date of this presentation and is subject to change at any time, based on market and other conditions. The information presented in the material is general in nature and is not designed to address your investment objectives, financial situation or particular needs. Prior to making any investment decision, you should assess, or seek advice from a professional regarding whether any particular transaction is relevant or appropriate to your individual circumstances. The information presented does not involve the rendering of personalized financial, legal or tax advice, but is limited to the dissemination of general information for educational purposes. Please consult financial, legal or tax professionals for specific information regarding your individual situation. This information does not constitute a solicitation or an offer to buy or sell any securities. Although taken from reliable sources, Genoa cannot guarantee the accuracy of the information received from third parties. Charts, diagrams, and graphs, by themselves, cannot be used to make investment decisions. Investing involves risk of loss, including loss of principal. Past performance is no guarantee of future results. An index is a portfolio of specific securities, the performance of which is often used as a benchmark in judging the relative performance of certain asset classes. Indexes are unmanaged portfolios and investors cannot invest directly in an index. An index does not charge management fees or brokerage expenses, and no such fees or expenses were deducted from the performance shown.