Written by Sarah Conwell, Portfolio Manager
Headlines of the Week
- Schumer sets Monday showdown on debt ceiling-government funding bill
- Evergrande stays silent on its $83 million dollar bond interest payment, leaving investors in limbo
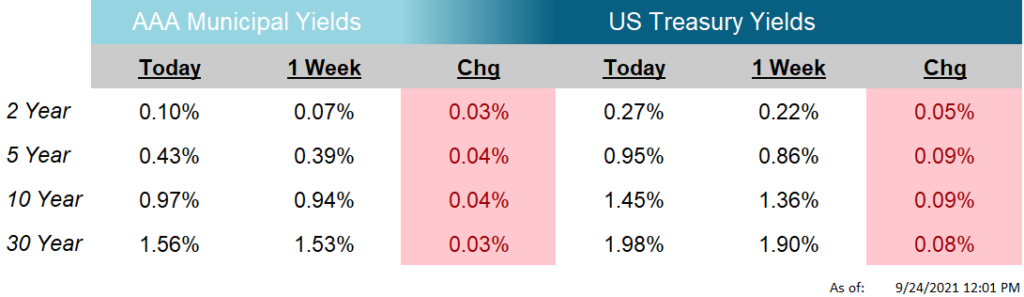
The US Treasury yield curve steepened in the week, with the lion’s share of the long-term Treasury yields’ increase coming after Wednesday’s Federal Open Market Committee (FOMC) meeting.
The week started off relatively calm, with housing-related data consuming the first two trading days from an economic standpoint. Housing Starts was released and increased 3.9% in August and Building Permits also increased in the month, by 6.0%. Existing Home Sales, however, declined 2.0% in August.
On Wednesday, the FOMC met and released information which market participants were eagerly awaiting to hear. The committee left the Fed Funds rate unchanged at 0-0.25% but made material changes to its statement, its Summary of Economic Projections (SEP), and the monetary policy outlook. In his press conference, Chairman Powell noted that the Fed’s qualification of “substantial further progress” had been met and the Fed would likely begin to taper asset purchases soon. Although he left the door open for flexibility in the event of a future economic calamity, most traders and analysts took this to mean he would announce the taper at the next meeting (November 3rd). In response, the 10-year Treasury yield has increased roughly 15 basis points since the meeting, as of this writing. This week’s Chart of the Week plots the movements in the 10-year Treasury yield since Monday, on a rolling 10-minute basis. Shortening the time relapse to 10 minutes helps to better illustrate the movements over short periods of time, such as in this graph, which is only 5 days.
Despite the Fed acknowledging the drastic economic improvement since the beginning of the cycle, it is certainly worth noting the substantial (mostly negative) changes in several economic indicators released in the SEP. First, median estimates of 2021 GDP declined to 5.9% in September’s meeting, down from 7.0% at June’s meeting. The median for 2022 GDP, however, was revised higher 50 basis points to 3.8%. In similar fashion, the median estimates for the 2021 Core PCE Deflator, the Fed’s inflation gauge, increased from 3.0% in June to 3.7% at the latest meeting. 2022’s median figure had but a small adjustment and is at 2.3%. The Committee noted that inflation “is elevated” but they are still attributing the increase to transitory factors. None of the committee members are forecasting the Fed Funds rate above 2% by the end of 2023, so it could be assumed that none of them foresee a grave issue with sustained rising prices (otherwise they would predict interest rates would rise to combat the inflation).
Next week, Durable Goods Orders is released on Monday, Consumer Confidence on Tuesday, and GDP, PCE, and Personal Income and Spending will be released on Thursday.
Chart of the Week
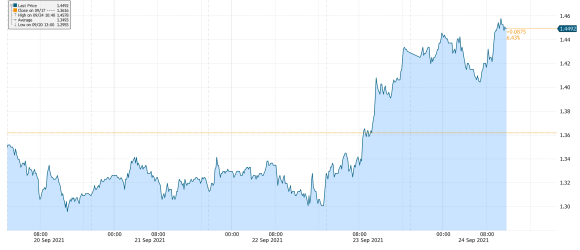
Source: Bloomberg, LP
As of: 9/24/2021
Click on the above links for more information on important investment and economic concepts.
Disclosures
Indexes used for AAA Municipal Yields
2 Year: BVAL Municipal AAA Yield Curve (Callable) 2 Year (Symbol: CAAA02YR BVLI)
5 Year: BVAL Municipal AAA Yield Curve (Callable) 5 Year (Symbol: CAAA04YR BVLI)
10 Year: BVAL Municipal AAA Yield Curve (Callable) 10 Year (Symbol: CAAA10YR BVLI)
30 Year: BVAL Municipal AAA Yield Curve (Callable) 30 Year (Symbol: CAAA30YR BVLI)
Indexes used for US Treasury Yields
2 Year: US Generic Govt 2 Year Yield (Symbol: USGG2YR)
5 Year: US Generic Govt 5 Year Yield (Symbol: USGG5YR)
10 Year: US Generic Govt 10 Year Yield (Symbol: USGG10YR)
30 Year: US Generic Govt 30 Year Yield (Symbol: USGG30YR) F/m Investments, LLC, doing business as Genoa Asset Management (Genoa), is an investment advisor registered under the Investment Advisers Act of 1940. Registration as an investment adviser does not imply any level of skill or training. The oral and written communications of an adviser provide you with information about which you determine to hire or retain an adviser. For more information please visit: https://adviserinfo.sec.gov/ and search our firm name. The opinions expressed herein are those of Genoa and may not come to pass. The material is current as of the date of this presentation and is subject to change at any time, based on market and other conditions. The information presented in the material is general in nature and is not designed to address your investment objectives, financial situation or particular needs. Prior to making any investment decision, you should assess, or seek advice from a professional regarding whether any particular transaction is relevant or appropriate to your individual circumstances. The information presented does not involve the rendering of personalized financial, legal or tax advice, but is limited to the dissemination of general information for educational purposes. Please consult financial, legal or tax professionals for specific information regarding your individual situation. This information does not constitute a solicitation or an offer to buy or sell any securities. Although taken from reliable sources, Genoa cannot guarantee the accuracy of the information received from third parties. Charts, diagrams, and graphs, by themselves, cannot be used to make investment decisions. Investing involves risk of loss, including loss of principal. Past performance is no guarantee of future results. An index is a portfolio of specific securities, the performance of which is often used as a benchmark in judging the relative performance of certain asset classes. Indexes are unmanaged portfolios and investors cannot invest directly in an index. An index does not charge management fees or brokerage expenses, and no such fees or expenses were deducted from the performance shown.