Written by Sarah Conwell, Portfolio Manager
Headlines of the Week
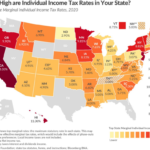
- Biden open to negotiating on corporate tax hike, but says U.S. must take bold action on infrastructure
- Explainer: What is a global minimum tax and how could it affect companies, countries?
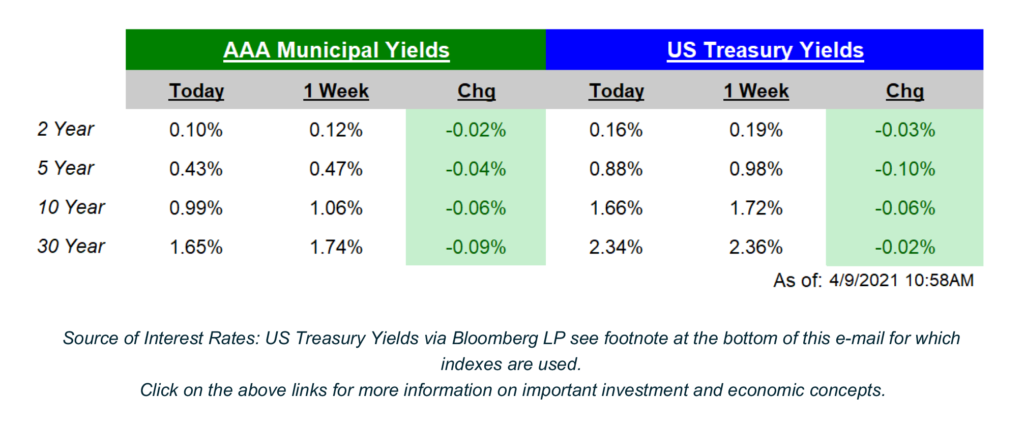
The US Treasury yield curve bull flattened in the week, with yields in the belly of the curve (5s/7s) declining a little less than 10 basis points (bps). Volatility in the Treasury market1 has declined of late, as traders begin to reconcile both inflation forecasts and the strong economic data that has been released during the new expansion.
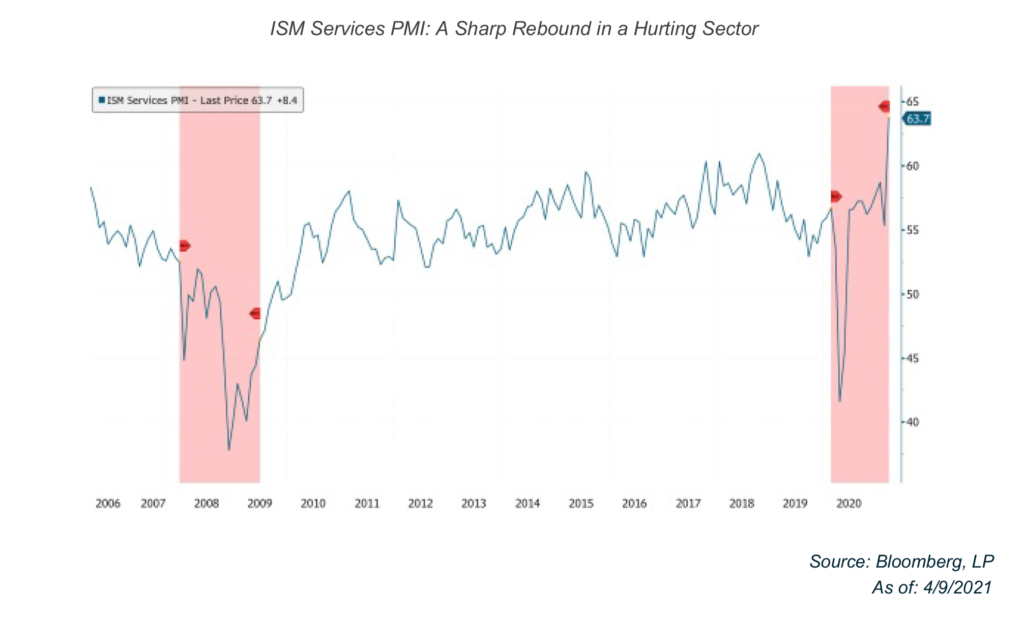
On Monday, the ISM Services Index shot up to 63.7 versus expectations of 59.0 and a prior read of 55.3. As a reminder, this is a diffusion index, so anything above 50 represents expansion and anything below 50 represents contraction in the sector. As you can see in this week’s Chart of the Week, 63.7 is the highest read to date in the survey, which is very important to note because this sector of the economy was the most adversely affected by the pandemic and subsequent shut down. All 18 sub-industries in the survey reported growth in March and it follows last week’s ISM Manufacturing Index, which hit the highest level since 1983.
Today, the Producer Prices Index (PPI) increased at the fastest annual pace since 2011. PPI in March increased 1.0% month-over-month (MoM) and 4.2% year-over-year (YoY); this compares to estimates of 0.5% and 3.8%, respectively. The Core Indexes, which exclude the volatile food and energy prices, rose 0.7% MoM and 3.1% YoY. Energy prices (+5.9% MoM), services costs (+0.7% MoM), and costs of goods (+1.7% MoM) were the main contributors to the jump in prices, although it is worth noting that the sharp increase in the YoY figure is a result of the lower prices last March, at the beginning of the pandemic (see: base effect). Yesterday, the Chairman of the Federal Reserve, Jerome Powell, noted that he expected prices to rise with the reopening of the economy and that these price pressures will likely subside over time.
Next week, Consumer Prices are reported on Tuesday, the Fed releases their Beige Book on Wednesday, and Retail Sales will be announced on Thursday.
1Measured by the ICE BofA MOVE Index, defined by Bloomberg as: a yield curve weighted index of the normalized implied volatility on 1-month Treasury options. It is the weighted average of volatilities on the CT2, CT5, CT10, and CT30. (weighted average of 1m2y, 1m5y, 1m10y and 1m30y Treasury implied vols with weights 0.2/0.2/0.4/0.2, respectively).
Chart of the Week
Disclosures
Indexes used for AAA Municipal Yields
2 Year: BVAL Municipal AAA Yield Curve (Callable) 2 Year (Symbol: CAAA02YR BVLI)
5 Year: BVAL Municipal AAA Yield Curve (Callable) 5 Year (Symbol: CAAA04YR BVLI)
10 Year: BVAL Municipal AAA Yield Curve (Callable) 10 Year (Symbol: CAAA10YR BVLI)
30 Year: BVAL Municipal AAA Yield Curve (Callable) 30 Year (Symbol: CAAA30YR BVLI)
Indexes used for US Treasury Yields
2 Year: US Generic Govt 2 Year Yield (Symbol: USGG2YR)
5 Year: US Generic Govt 5 Year Yield (Symbol: USGG5YR)
10 Year: US Generic Govt 10 Year Yield (Symbol: USGG10YR)
30 Year: US Generic Govt 30 Year Yield (Symbol: USGG30YR) F/m Investments, LLC, doing business as Genoa Asset Management (Genoa), is an investment advisor registered under the Investment Advisers Act of 1940. Registration as an investment adviser does not imply any level of skill or training. The oral and written communications of an adviser provide you with information about which you determine to hire or retain an adviser. For more information please visit: https://adviserinfo.sec.gov/ and search our firm name. The opinions expressed herein are those of Genoa and may not come to pass. The material is current as of the date of this presentation and is subject to change at any time, based on market and other conditions. The information presented in the material is general in nature and is not designed to address your investment objectives, financial situation or particular needs. Prior to making any investment decision, you should assess, or seek advice from a professional regarding whether any particular transaction is relevant or appropriate to your individual circumstances. The information presented does not involve the rendering of personalized financial, legal or tax advice, but is limited to the dissemination of general information for educational purposes. Please consult financial, legal or tax professionals for specific information regarding your individual situation. This information does not constitute a solicitation or an offer to buy or sell any securities. Although taken from reliable sources, Genoa cannot guarantee the accuracy of the information received from third parties. Charts, diagrams, and graphs, by themselves, cannot be used to make investment decisions. Investing involves risk of loss, including loss of principal. Past performance is no guarantee of future results. An index is a portfolio of specific securities, the performance of which is often used as a benchmark in judging the relative performance of certain asset classes. Indexes are unmanaged portfolios and investors cannot invest directly in an index. An index does not charge management fees or brokerage expenses, and no such fees or expenses were deducted from the performance shown.