Written by Sarah Conwell, Portfolio Manager
Headlines of the Week
- Fed Says U.S. Economic Activity Has Picked Up to Moderate Pace
- Coinbase stock closes down day after landmark Nasdaq debut
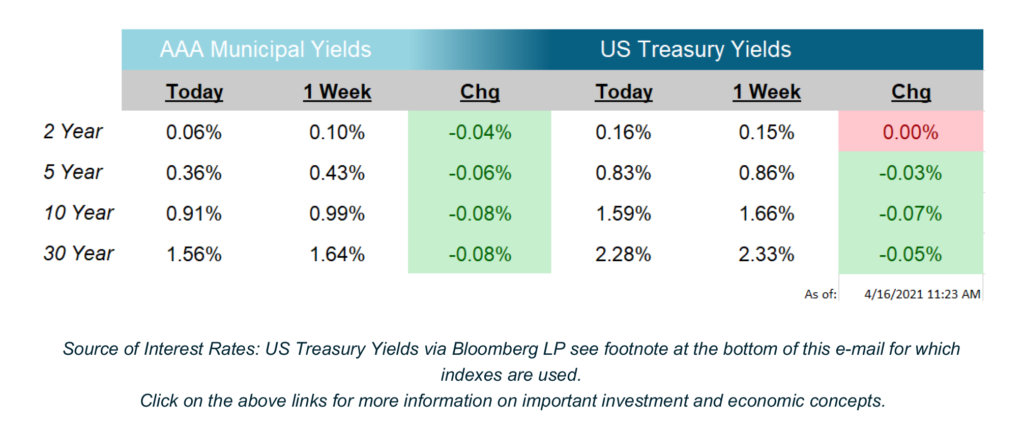
The US Treasury yield curve flattened for the second week in a row as traders attempt to reconcile current interest rates with the materialization of previously anticipated economic data. When the 10-year Treasury yield shot up by roughly 34 basis points in the month of February, many analysts viewed this sharp increase as a forecast of future strength in the domestic economy. Now that this strength has been proven in recent economic prints, traders seem to be right-sizing and perfecting the level of rates that make the most sense for the benchmark yield; this has resulted in a slight decline of about 6 basis points over the past two weeks, as of this writing.
On Tuesday, the Consumer Price Index (CPI) increased 0.6% month-over-month on headline basis and the Core Index rose 0.3%; both figures were above consensus expectations and prior month’s prints. The increase came on the back of transportation-related services, which have benefitted as states reopen and consumers spend more to travel. In addition, the recent movement in gas prices also had a material effect on the increase, with the price of
gasoline rising 9.1% in the month of March.
Initial Jobless Claims, released yesterday, came in at the lowest level since March of last year, although it remains well above long-term averages. The figure came in at 576k claims, far below the average of ~1,400k claims during this recession and the average of ~780k claims year-to-date; prior to this recession however, the long-term average was near 350k.
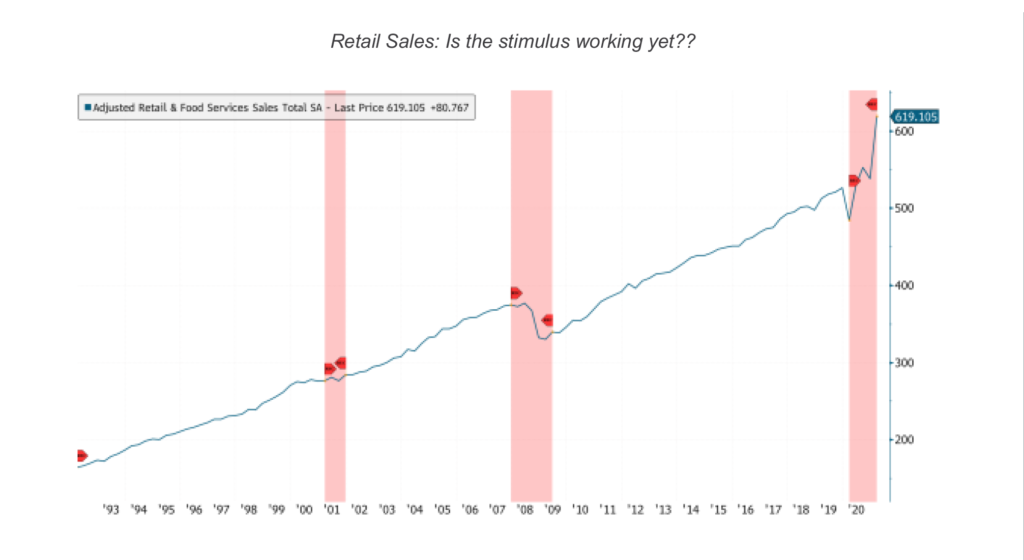
Retail Sales stole the show this week, far exceeding expectations of a 5.8% gain in March and printing an increase of 9.8%. The most recent stimulus checks, warmer weather, and the economy reopening likely all played a hand in this strong figure as it was the largest increase since last May. Notable contributors were gasoline station sales (+10.9%), car sales (+15.1%), building materials sales (+12.1%), clothing sales (+18.3%), eating and drinking (+13.4%), sporting goods sales (+23.5%), and department store sales (+13%). Unsurprisingly, there is certainly a trend in the above categories; consumers seem to be increasingly comfortable with getting out of their house and spending money. This week’s Chart of the Week, the y-axis plots the total Retail and Food Services Sales (as opposed to a monthly percentage change) dating back to the early 1990s. As you can see, the most recent uptick in spending far exceeds the implied trendline in sales.
Next week is a very light week on the economic front with just Initial Jobless Claims and the
Markit Manufacturing PMI being the highlights.
Chart of the Week
Disclosures
Indexes used for AAA Municipal Yields
2 Year: BVAL Municipal AAA Yield Curve (Callable) 2 Year (Symbol: CAAA02YR BVLI)
5 Year: BVAL Municipal AAA Yield Curve (Callable) 5 Year (Symbol: CAAA04YR BVLI)
10 Year: BVAL Municipal AAA Yield Curve (Callable) 10 Year (Symbol: CAAA10YR BVLI)
30 Year: BVAL Municipal AAA Yield Curve (Callable) 30 Year (Symbol: CAAA30YR BVLI)
Indexes used for US Treasury Yields
2 Year: US Generic Govt 2 Year Yield (Symbol: USGG2YR)
5 Year: US Generic Govt 5 Year Yield (Symbol: USGG5YR)
10 Year: US Generic Govt 10 Year Yield (Symbol: USGG10YR)
30 Year: US Generic Govt 30 Year Yield (Symbol: USGG30YR) F/m Investments, LLC, doing business as Genoa Asset Management (Genoa), is an investment advisor registered under the Investment Advisers Act of 1940. Registration as an investment adviser does not imply any level of skill or training. The oral and written communications of an adviser provide you with information about which you determine to hire or retain an adviser. For more information please visit: https://adviserinfo.sec.gov/ and search our firm name. The opinions expressed herein are those of Genoa and may not come to pass. The material is current as of the date of this presentation and is subject to change at any time, based on market and other conditions. The information presented in the material is general in nature and is not designed to address your investment objectives, financial situation or particular needs. Prior to making any investment decision, you should assess, or seek advice from a professional regarding whether any particular transaction is relevant or appropriate to your individual circumstances. The information presented does not involve the rendering of personalized financial, legal or tax advice, but is limited to the dissemination of general information for educational purposes. Please consult financial, legal or tax professionals for specific information regarding your individual situation. This information does not constitute a solicitation or an offer to buy or sell any securities. Although taken from reliable sources, Genoa cannot guarantee the accuracy of the information received from third parties. Charts, diagrams, and graphs, by themselves, cannot be used to make investment decisions. Investing involves risk of loss, including loss of principal. Past performance is no guarantee of future results. An index is a portfolio of specific securities, the performance of which is often used as a benchmark in judging the relative performance of certain asset classes. Indexes are unmanaged portfolios and investors cannot invest directly in an index. An index does not charge management fees or brokerage expenses, and no such fees or expenses were deducted from the performance shown.