Written by Sarah Conwell, Portfolio Manager
Headlines of the Week
- Fed Chair Powell grilled by grouchy senators over inflation and climate change, even as economy rebounds
- U.S. Senate Democrats agree to $3.5 trln for budget reconciliation bill
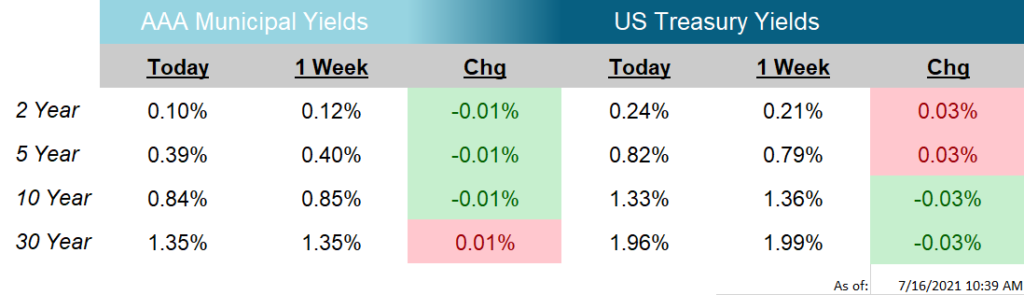
The US Treasury yield curve was little changed week-over-week, with the largest movement coming in the 3-year yield, an increase of about 6 basis points (bps). The rest of the curve moved less than 3 bps in either direction (increase/decrease).
On Tuesday, the Consumer Price Index (CPI) was released and was almost double expectations on a month-over-month (MoM) basis. Prices increased 0.9% in June on both a headline and core basis, higher than expectations of a 0.5% and 0.4% increase, respectively. The year-over-year figure now stands at 5.4% and 4.5% on a headline and core basis. The data for June showed that most of the monthly increase could be attributed used cars and trucks, new vehicles, air fares, and apparel. All of which were affected by the closing of the economy in 2020 and are now facing increasing prices as higher demand and supply constraints work their way through the economy. Due to these two factors, economists (and more importantly, the Fed) are not expecting prices to remain elevated in the long-term.
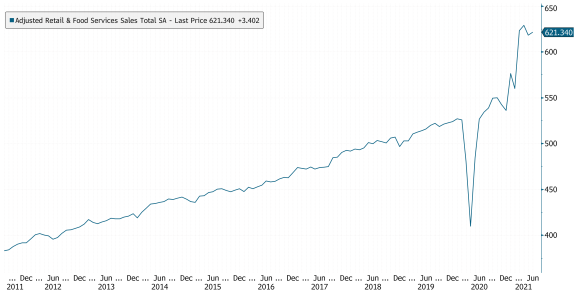
Today, Retail Sales were released and exceeded expectations by a considerable margin. Sales rose 0.6% in June, compared to expectations of a 0.3% decline, however, May was revised down by 0.4 percentage points to -1.7%. 9 of the 13 categories increase in June, including electronics and appliances, clothing, and restaurants. Sales of vehicles and vehicle parts declined in the month, likely a result of supply chain disruptions and price increases, as noted above (see: semiconductor shortage). As you can see in this week’s Chart of the Week, total retail sales has made quite an impressive comeback over the past year even when factoring in the slight pullback from last month, more evidence that the consumer will remain the workhorse of the US economy.
Next week, Building Permits and Housing Starts will be released on Tuesday, the Leading Index on Thursday, and Markit PMIs on Friday.
Chart of the Week
As of: 7/16/2021
Click on the above links for more information on important investment and economic concepts.
Disclosures
Indexes used for AAA Municipal Yields
2 Year: BVAL Municipal AAA Yield Curve (Callable) 2 Year (Symbol: CAAA02YR BVLI)
5 Year: BVAL Municipal AAA Yield Curve (Callable) 5 Year (Symbol: CAAA04YR BVLI)
10 Year: BVAL Municipal AAA Yield Curve (Callable) 10 Year (Symbol: CAAA10YR BVLI)
30 Year: BVAL Municipal AAA Yield Curve (Callable) 30 Year (Symbol: CAAA30YR BVLI)
Indexes used for US Treasury Yields
2 Year: US Generic Govt 2 Year Yield (Symbol: USGG2YR)
5 Year: US Generic Govt 5 Year Yield (Symbol: USGG5YR)
10 Year: US Generic Govt 10 Year Yield (Symbol: USGG10YR)
30 Year: US Generic Govt 30 Year Yield (Symbol: USGG30YR) F/m Investments, LLC, doing business as Genoa Asset Management (Genoa), is an investment advisor registered under the Investment Advisers Act of 1940. Registration as an investment adviser does not imply any level of skill or training. The oral and written communications of an adviser provide you with information about which you determine to hire or retain an adviser. For more information please visit: https://adviserinfo.sec.gov/ and search our firm name. The opinions expressed herein are those of Genoa and may not come to pass. The material is current as of the date of this presentation and is subject to change at any time, based on market and other conditions. The information presented in the material is general in nature and is not designed to address your investment objectives, financial situation or particular needs. Prior to making any investment decision, you should assess, or seek advice from a professional regarding whether any particular transaction is relevant or appropriate to your individual circumstances. The information presented does not involve the rendering of personalized financial, legal or tax advice, but is limited to the dissemination of general information for educational purposes. Please consult financial, legal or tax professionals for specific information regarding your individual situation. This information does not constitute a solicitation or an offer to buy or sell any securities. Although taken from reliable sources, Genoa cannot guarantee the accuracy of the information received from third parties. Charts, diagrams, and graphs, by themselves, cannot be used to make investment decisions. Investing involves risk of loss, including loss of principal. Past performance is no guarantee of future results. An index is a portfolio of specific securities, the performance of which is often used as a benchmark in judging the relative performance of certain asset classes. Indexes are unmanaged portfolios and investors cannot invest directly in an index. An index does not charge management fees or brokerage expenses, and no such fees or expenses were deducted from the performance shown.