Written by Sarah Conwell, Portfolio Manager
Headlines of the Week
- ECB Signals Readiness to Curb Bank Dividends When Cap Lifts
- Dow jumps 200 points, S&P 500 rises to record as stocks head for winning week
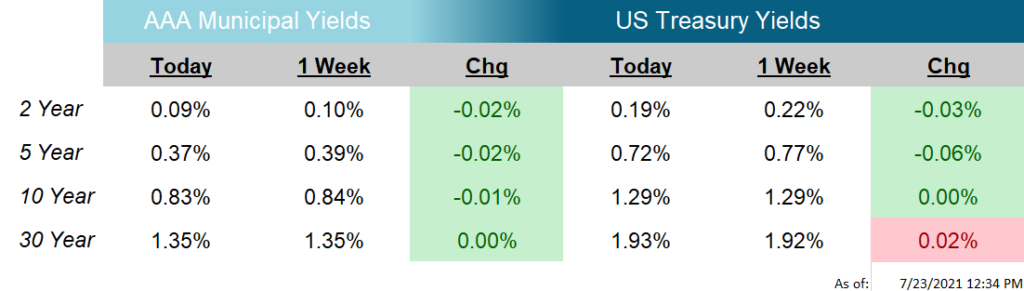
The US Treasury yield curve was again little changed in the week, with yields in the belly of the curve (3s, 5s, and 7s) declining anywhere from 3 to 6 basis points and no material increase or decreases elsewhere. It appears investors and traders took a slight pause from participating in market movements in the quiet economic week.
Housing Starts, a relatively volatile figure, grew 6.3% in June to an annualized 1.6 million figure, the largest increase in 3 months. On the contrary, Building Permits fell 5.1% in June, the third month in a row a negative reading hit the tape. Building Permits is also a volatile figure, but unlike Housing Starts it acts as a leading indicator. Persistent negative trends in permits is likely to result in a decline in overall sentiment for the housing market.1 To wrap up the housing data, Existing Home Sales increased 1.4% last month, slightly short of the 1.7% expectations. The prior month’s reading, May, for all three, Housing Starts, Building Permits, and Existing Home Sales, were revised lower, another indication that the extreme increases in home prices we have witnessed over the past year could be taking a toll on overall demand in the sector. As you can see in this week’s Chart of the Week, Housing Starts maintain their upward trajectory, but it appears to be slowing to an extent (see annotation).
Next week brings a full slate of activity: New Home Sales will be released on Monday, Durable Goods on Tuesday, the FOMC meeting and subsequent rate decision on Wednesday, GDP on Thursday, and Personal Income and Spending on Friday.
1We haven’t seen quite the persistence needed to see this reaction, this is just something to keep in mind if these negative readings continue into the fall and winter months.
Chart of the Week
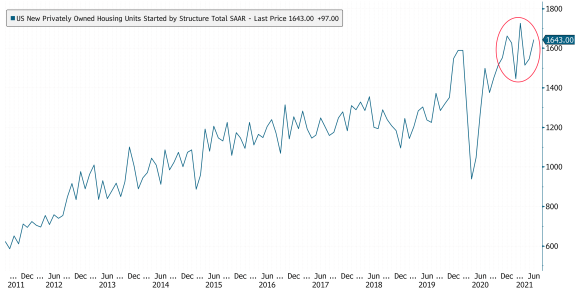
As of: 7/23/2021
Click on the above links for more information on important investment and economic concepts.
Disclosures
Indexes used for AAA Municipal Yields
2 Year: BVAL Municipal AAA Yield Curve (Callable) 2 Year (Symbol: CAAA02YR BVLI)
5 Year: BVAL Municipal AAA Yield Curve (Callable) 5 Year (Symbol: CAAA04YR BVLI)
10 Year: BVAL Municipal AAA Yield Curve (Callable) 10 Year (Symbol: CAAA10YR BVLI)
30 Year: BVAL Municipal AAA Yield Curve (Callable) 30 Year (Symbol: CAAA30YR BVLI)
Indexes used for US Treasury Yields
2 Year: US Generic Govt 2 Year Yield (Symbol: USGG2YR)
5 Year: US Generic Govt 5 Year Yield (Symbol: USGG5YR)
10 Year: US Generic Govt 10 Year Yield (Symbol: USGG10YR)
30 Year: US Generic Govt 30 Year Yield (Symbol: USGG30YR) F/m Investments, LLC, doing business as Genoa Asset Management (Genoa), is an investment advisor registered under the Investment Advisers Act of 1940. Registration as an investment adviser does not imply any level of skill or training. The oral and written communications of an adviser provide you with information about which you determine to hire or retain an adviser. For more information please visit: https://adviserinfo.sec.gov/ and search our firm name. The opinions expressed herein are those of Genoa and may not come to pass. The material is current as of the date of this presentation and is subject to change at any time, based on market and other conditions. The information presented in the material is general in nature and is not designed to address your investment objectives, financial situation or particular needs. Prior to making any investment decision, you should assess, or seek advice from a professional regarding whether any particular transaction is relevant or appropriate to your individual circumstances. The information presented does not involve the rendering of personalized financial, legal or tax advice, but is limited to the dissemination of general information for educational purposes. Please consult financial, legal or tax professionals for specific information regarding your individual situation. This information does not constitute a solicitation or an offer to buy or sell any securities. Although taken from reliable sources, Genoa cannot guarantee the accuracy of the information received from third parties. Charts, diagrams, and graphs, by themselves, cannot be used to make investment decisions. Investing involves risk of loss, including loss of principal. Past performance is no guarantee of future results. An index is a portfolio of specific securities, the performance of which is often used as a benchmark in judging the relative performance of certain asset classes. Indexes are unmanaged portfolios and investors cannot invest directly in an index. An index does not charge management fees or brokerage expenses, and no such fees or expenses were deducted from the performance shown.