Written by Peter Baden, CFA, Chief Investment Officer
Headlines of the Week
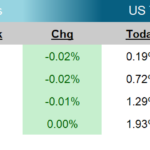
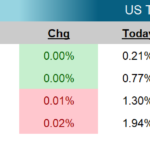
What started out as potentially busy and exciting, turned into a relatively quiet summer week. The US Treasury yield curve continue to flatten, marking almost two months of steadily lower long rates. Since June 3rd the 10-year Treasury yield has fallen almost 40 basis points, but only about 4 basis points in the last week. With the slowing rally in bonds, it seems traders who were counting on a steeper curve have righted their positions, preparing for the next move.
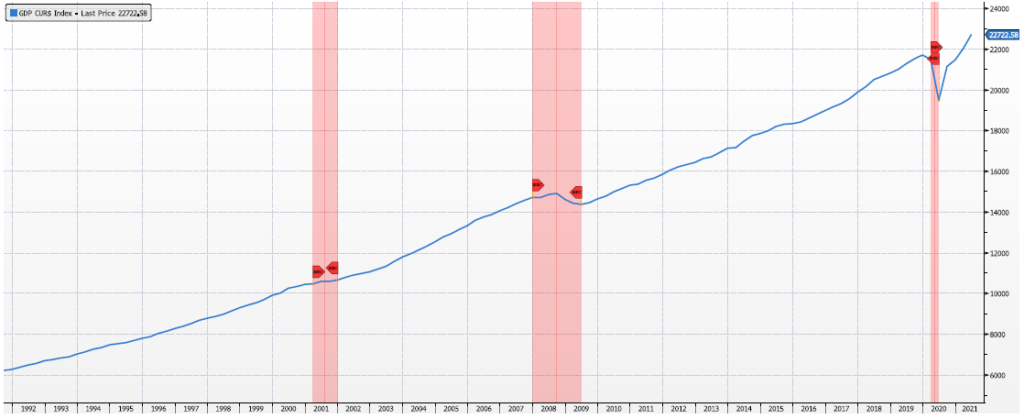
Headlining the economic news in the week was the GDP report. While headline GDP growth of 6.5% missed economist’s consensus estimates of 8.5%, consumer spending grew significantly at 11.8%. Not surprisingly international sales and inventories held back GDP growth. At this rate, GDP activity could return to peak much sooner than the estimated three years Fed Policy makers expected back in March 2020.
The Federal Reserve Open Market Committee meeting was held this week. Statements and news conferences held little surprise (Something the Fed Governors are getting better about). The Fed Governors continue to stress, recent inflation readings are “Transitory”. However, they concede, some of this transitory inflation may be somewhat sticky going forward. With the GDP report, tempered by the rise in infections from the COVID Delta variant, the Fed Chairman said they are moving closer to when they can start reducing their massive support for the US economy, but there is still some way to go.
Next week we get the readings on manufacturing with ISM on Monday, Factory Orders on Tuesday. Last but not least jobs data will be release Friday with economists estimating a 5.7% Unemployment Rate.
Chart of the Week
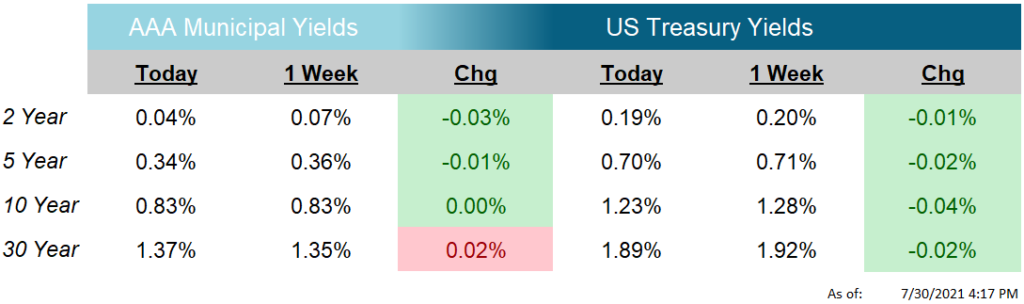
As of: 7/30/2021
Click on the above links for more information on important investment and economic concepts.
Disclosures
Indexes used for AAA Municipal Yields
2 Year: BVAL Municipal AAA Yield Curve (Callable) 2 Year (Symbol: CAAA02YR BVLI)
5 Year: BVAL Municipal AAA Yield Curve (Callable) 5 Year (Symbol: CAAA04YR BVLI)
10 Year: BVAL Municipal AAA Yield Curve (Callable) 10 Year (Symbol: CAAA10YR BVLI)
30 Year: BVAL Municipal AAA Yield Curve (Callable) 30 Year (Symbol: CAAA30YR BVLI)
Indexes used for US Treasury Yields
2 Year: US Generic Govt 2 Year Yield (Symbol: USGG2YR)
5 Year: US Generic Govt 5 Year Yield (Symbol: USGG5YR)
10 Year: US Generic Govt 10 Year Yield (Symbol: USGG10YR)
30 Year: US Generic Govt 30 Year Yield (Symbol: USGG30YR) F/m Investments, LLC, doing business as Genoa Asset Management (Genoa), is an investment advisor registered under the Investment Advisers Act of 1940. Registration as an investment adviser does not imply any level of skill or training. The oral and written communications of an adviser provide you with information about which you determine to hire or retain an adviser. For more information please visit: https://adviserinfo.sec.gov/ and search our firm name. The opinions expressed herein are those of Genoa and may not come to pass. The material is current as of the date of this presentation and is subject to change at any time, based on market and other conditions. The information presented in the material is general in nature and is not designed to address your investment objectives, financial situation or particular needs. Prior to making any investment decision, you should assess, or seek advice from a professional regarding whether any particular transaction is relevant or appropriate to your individual circumstances. The information presented does not involve the rendering of personalized financial, legal or tax advice, but is limited to the dissemination of general information for educational purposes. Please consult financial, legal or tax professionals for specific information regarding your individual situation. This information does not constitute a solicitation or an offer to buy or sell any securities. Although taken from reliable sources, Genoa cannot guarantee the accuracy of the information received from third parties. Charts, diagrams, and graphs, by themselves, cannot be used to make investment decisions. Investing involves risk of loss, including loss of principal. Past performance is no guarantee of future results. An index is a portfolio of specific securities, the performance of which is often used as a benchmark in judging the relative performance of certain asset classes. Indexes are unmanaged portfolios and investors cannot invest directly in an index. An index does not charge management fees or brokerage expenses, and no such fees or expenses were deducted from the performance shown.