Written by Peter Baden, CFA, Chief Investment Officer
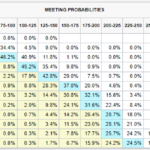
As we foreshadowed in our earlier updates, the January CPI report was going to be high, and it did not disappoint. The market reaction was swift, with the yields rising across the board. When some Fed governors used speaking opportunities to push to address inflation now, interest rate futures indicated as many as 7 rate increases in 2022. The release of the Fed December meeting minutes calmed anxiety somewhat, but investors are now concerned the Fed would push the economy into a recession to tame inflation. As of this morning, CME futures are indicating 6 increases to the overnight Fed Funds Rate in 2022 (See below) with the top boundary rising from 0.25% to 1.75%.
It is a reasonable question to ask:
The Fed hasn’t even started raising rates and bonds indexes are down, what happens when they do start raising rates?
First, the bond markets have gone up in anticipation of the coming Fed rate hikes. On August 4th 2021, the 2- & 3- Year USTs were yielding 0.21% and 0.32% respectively. On February 10th they both hit highs of 1.58% (137 basis points higher) and 1.81% (149 basis points higher). If the Fed is going to hike the overnight rate 150 basis points in 2022, bond markets have already adjusted significantly anticipating those increases. Since those highs, prices have rallied to bring the 2- & 3-year UST yields to 1.47% and 1.68% (As of this morning).
Next, when the Fed starts raising rates (And shrinking their balance sheet), credit spreads will widen as risk-free UST rates become more attractive. The last time a 3 year UST was yielding this high was 1.75% on September 13, 2019. That can be attractive for risk-averse investors who can move money out of risky assets to US Treasuries.
Additionally, credit spreads have widened as the risk of a Fed induced recession has increased. If inflation continues at its current pace, the markets are concerned the Fed may need to increase the Overnight rate faster and higher than the economy can sustain causing a recession. The ‘R’ word is relative, given the last two recessions were the Pandemic and the Great Recession, and looks to be a 2023 event rather than 2022. Meanwhile, The Bloomberg US Corporate High Yield Average Option Adjusted Spreads have widened from the very tight levels in December (+270 bps) closer to historical averages (+363 bps).
The next reasonable question:
What are you currently doing in portfolios to mitigate the effects of higher interest rates?
First, our Tax-Free strategies have been high quality, averaging AA- to A+ in credit quality. We have already shortened the duration in our portfolios (A measure of interest rate sensitivity) and we continue to review the portfolios for opportunities to improve yield and duration of the portfolio. We have been finding value in high coupon, 7–10 year municipal bonds with 3-6 year calls while still maintaining the short end of our bar-bell portfolio. The good news, after this market reset, new, general market, tax-free municipal portfolios are yielding approximately 2.00% and have a 4.5 year duration.
For our Opportunistic Income strategy, we have improved credit quality, reduced our preferred stock exposure, and shortened our duration selling some of our longer duration bonds and purchasing shorter duration bonds. We are also increasing our allocation to floating rate securities, allowing us to benefit from rate increases and potentially reduce the volatility of the portfolios. Currently, new taxable portfolios are yielding approximately 4.06% with a 4.16 year duration.
Similarly in our Quality Income strategy, we have improved credit quality and shorted the duration of the portfolios. We are also increasing our allocation to floating rate bonds. With the increase in rates, new high-quality taxable portfolios are yielding 2.62% with a 5.59 year duration.
While the market has seen a pullback, the lower bond prices have increased the yield available on the bonds. This opens an opportunity to invest at higher rates not available in the last year.
There are other very reasonable questions, feel free to contact us and pose them to our team. We will do our best to give you a reasonable answer.
3-Year US Treasury Yield
12-months ended 2-18-2022
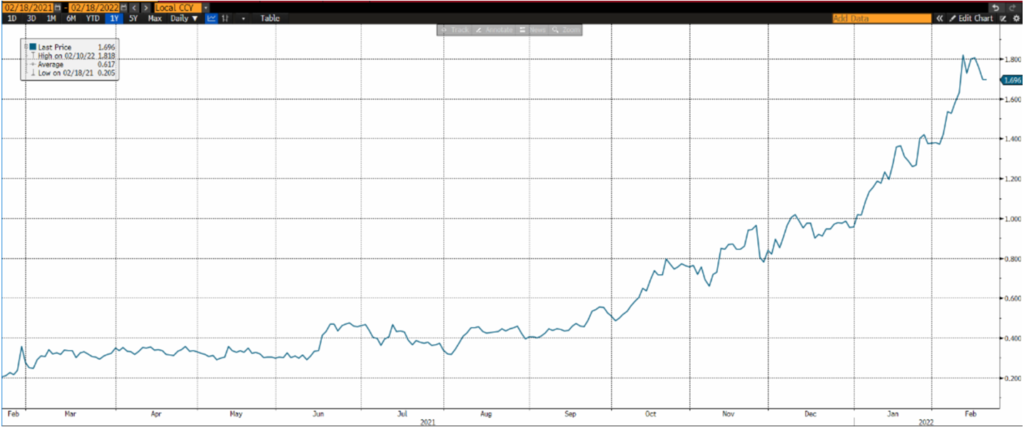
As of: 02/18/2022
CME FedWatch Tool
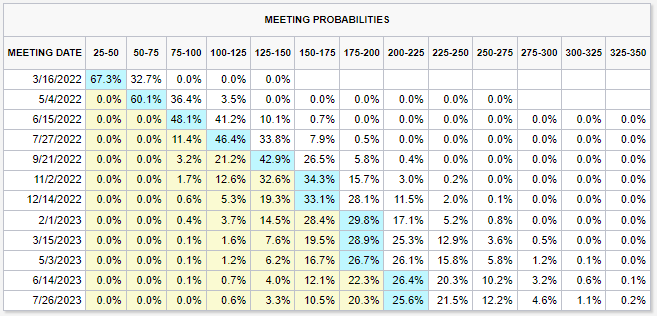
As of: 01/28/2022
Click on the above links for more information on important investment and economic concepts.
Disclosures
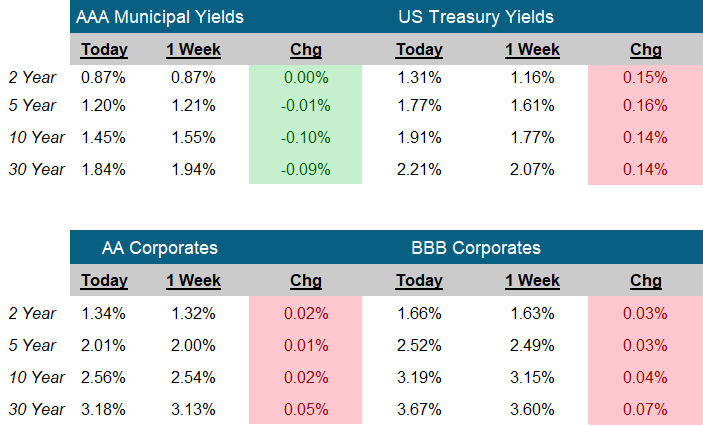
Indexes used for AAA Municipal Yields
2 Year: BVAL Municipal AAA Yield Curve (Callable) 2 Year (Symbol: CAAA02YR BVLI)
5 Year: BVAL Municipal AAA Yield Curve (Callable) 5 Year (Symbol: CAAA04YR BVLI)
10 Year: BVAL Municipal AAA Yield Curve (Callable) 10 Year (Symbol: CAAA10YR BVLI)
30 Year: BVAL Municipal AAA Yield Curve (Callable) 30 Year (Symbol: CAAA30YR BVLI)
Indexes used for US Treasury Yields
2 Year: US Generic Govt 2 Year Yield (Symbol: USGG2YR)
5 Year: US Generic Govt 5 Year Yield (Symbol: USGG5YR)
10 Year: US Generic Govt 10 Year Yield (Symbol: USGG10YR)
30 Year: US Generic Govt 30 Year Yield (Symbol: USGG30YR) F/m Investments, LLC, doing business as Genoa Asset Management (Genoa), is an investment advisor registered under the Investment Advisers Act of 1940. Registration as an investment adviser does not imply any level of skill or training. The oral and written communications of an adviser provide you with information about which you determine to hire or retain an adviser. For more information please visit: https://adviserinfo.sec.gov/ and search our firm name. The opinions expressed herein are those of Genoa and may not come to pass. The material is current as of the date of this presentation and is subject to change at any time, based on market and other conditions. The information presented in the material is general in nature and is not designed to address your investment objectives, financial situation or particular needs. Prior to making any investment decision, you should assess, or seek advice from a professional regarding whether any particular transaction is relevant or appropriate to your individual circumstances. The information presented does not involve the rendering of personalized financial, legal or tax advice, but is limited to the dissemination of general information for educational purposes. Please consult financial, legal or tax professionals for specific information regarding your individual situation. This information does not constitute a solicitation or an offer to buy or sell any securities. Although taken from reliable sources, Genoa cannot guarantee the accuracy of the information received from third parties. Charts, diagrams, and graphs, by themselves, cannot be used to make investment decisions. Investing involves risk of loss, including loss of principal. Past performance is no guarantee of future results. An index is a portfolio of specific securities, the performance of which is often used as a benchmark in judging the relative performance of certain asset classes. Indexes are unmanaged portfolios and investors cannot invest directly in an index. An index does not charge management fees or brokerage expenses, and no such fees or expenses were deducted from the performance shown.