January 24, 2023
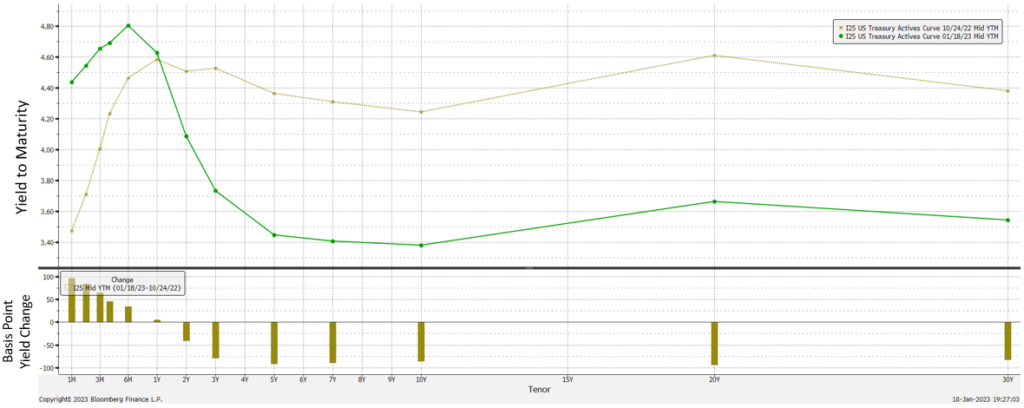
Take a look at the yield curve chart below. The gold line is the curve on October 24, 2022 (The day the yield on the 10-Year US Treasury hit its most recent high), the green line is January 18, 2023. Since that point in October, the curve has twisted on the one year tenor, with shorter rates rising and longer rates falling. Why is this? The curve is listening to the Fed, reading the inflation reports and responding appropriately, given the factors that affect each tenor.
On the short end, investors heard the Fed, higher for longer. Rates rose in anticipation of those higher short-term rates the Fed was promising. The inflation readings have shown improvement and the Fed has slowed the rate of increases, hinting we are nearing the terminal rate. So the 2-year moderated a little, but remained somewhat high.
The rest of the curve also listened to the Fed, they heard Chair Powell say: ”Until The Job is Well and Truly Done”. That determination, along with the inflation readings, gave investors confidence inflation would cool and they bought the 10-Year US Treasury. Since October 24, the ICE Current 10-Year US Treasury Index (GA10) has returned 7.01%.
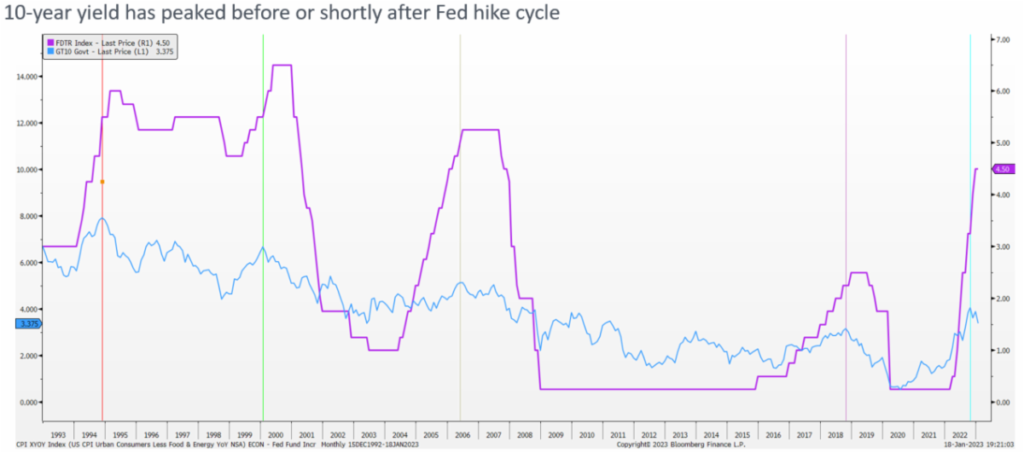
How long can the rally last? Hard to tell, but we can look to history to help guide us. The interest rate cycle chart below overlays the Overnight Fed Funds Rate and the 10-Year yield. We added vertical lines on each cycle at the peak 10-Year yield. Since 1993, the 10-Year has peaked and started a rally before, or just after, the Fed has finished raising the Overnight Fed Funds Rate. Each of those rallies have lasted for years and some have moved considerably lower.
Have we seen peak long-term rates? Possibly. But as we recommended last year, rates are still higher than 2021, pick a term that works for your portfolio and start averaging into a full position. We think you will be pleased with the returns as we move through the rest of this cycle and into the next.
-Peter Baden, CFA
Chief Investment Officer
Click on the above links for more information on important investment and economic concepts.
The Yield Curve
10-24-2022 (Gold) versus 1-18-23 (Green)
The Interest Rate Cycle
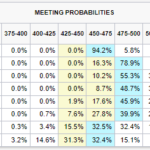
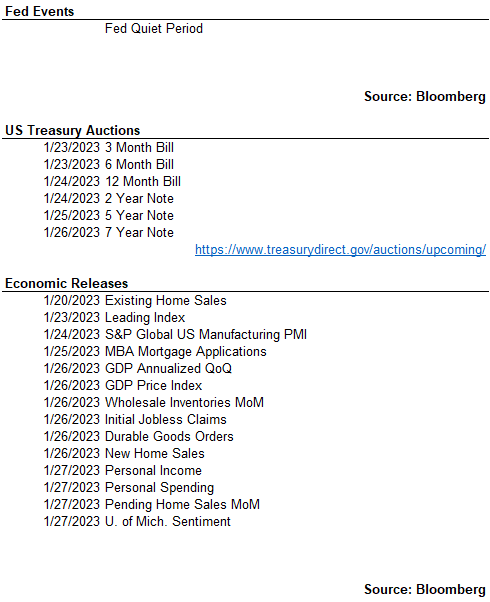
Next FOMC Decision
February 1, 2023
The Week Ahead
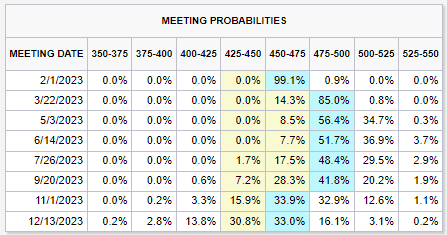
CME Fed Watch Tool
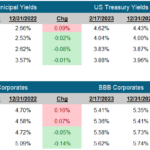
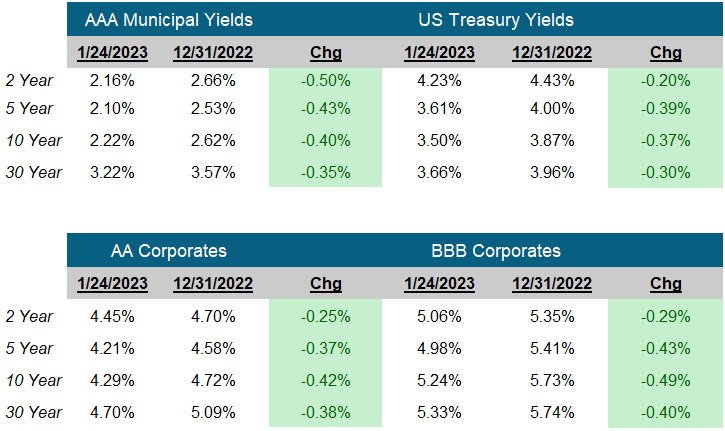
Fixed Income Rates
Click on the above links for more information on important investment and economic concepts.
Contact Genoa Asset Management
William (Kip) Weese
SVP, Intermediary Sales
Northeast & South West
(508) 423-2269
Email Kip
Rick Bell
VP, Intermediary Sales
North Central & North West
(513) 762-3694
Email Rick