Written by Peter Baden, CFA, Chief Investment Officer
Headlines of the Week
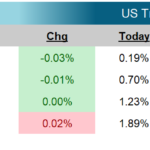
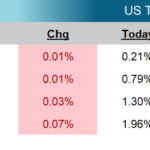
With COVID variants spreading, companies reporting and entertainment events happening, the markets ranged from concerns of a slow down, to the reopening is happening on schedule. The US Treasury yield curve continued to flatten, but only because intermediate rates increased more than long rates. The give back in yields was focused on the “Belly” of the curve with the 3, 5 and 7 year US Treasury giving up around 8 basis points, compared to 7 basis points for the 10 year, and 5 basis points for the 30 year. Traders reacted to improving vaccination rates, good corporate reports and few signs the economy will close to battle COVID.
Headlining the weeks economic news was the jobs report. The Change in Nonfarm Payrolls was 943k, ahead of consensus forecasts of 870k. Last month number was revised up to 938k versus 850k. The Unemployment Rate declined to 5.4% below the 5.7% consensus estimate and an improvement on last month’s 5.9%. While both numbers are promising for economic growth, the Average Hourly Earnings rose 4%, potentially concerning for future inflation.
This week the US Treasury announced their August refunding schedule. Importantly, the Treasury highlighted their “expectation of announcing an initial set of auction size reductions as soon as the November refunding announcement.” This is quite a forceful statement from Treasury, which usually avoids pre-committing. This announcement, potentially around the same time as tapering the Fed’s Bond Buying Program is considered, might make a repeat of the Taper Tantrum less likely.
Next week we get the readings on CPI and PPI. With recent prints exceeding expectations, markets will be looking for transitory, sticky or worse spreading indications in the numbers.
Chart of the Week
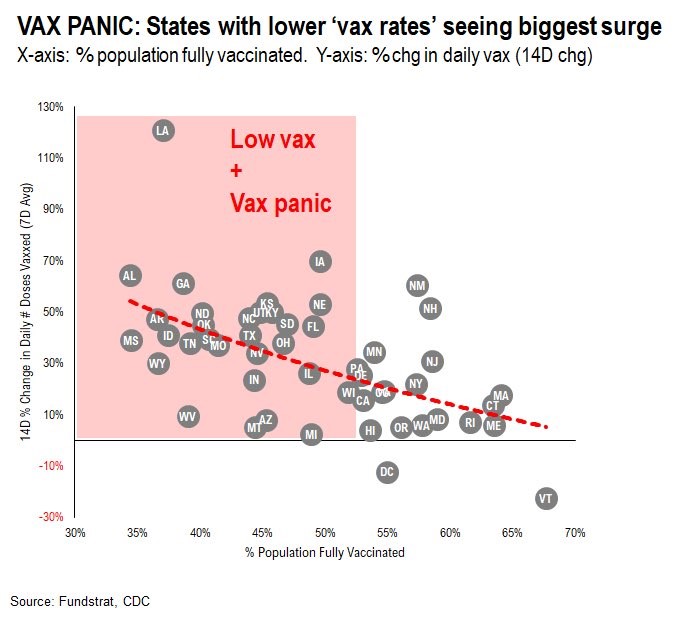
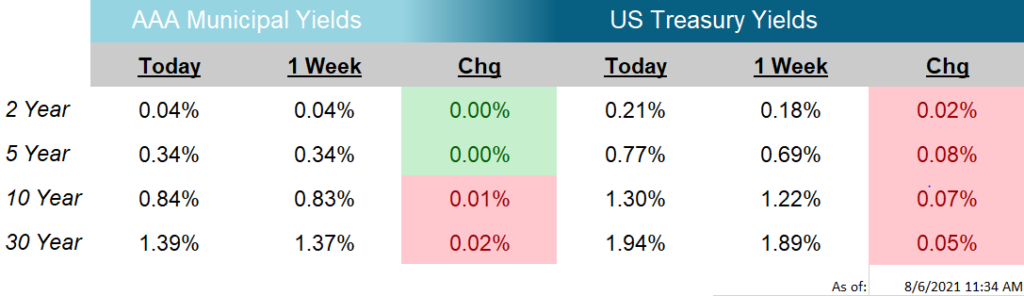
As of: 8/3/2021
Click on the above links for more information on important investment and economic concepts.
Disclosures
Indexes used for AAA Municipal Yields
2 Year: BVAL Municipal AAA Yield Curve (Callable) 2 Year (Symbol: CAAA02YR BVLI)
5 Year: BVAL Municipal AAA Yield Curve (Callable) 5 Year (Symbol: CAAA04YR BVLI)
10 Year: BVAL Municipal AAA Yield Curve (Callable) 10 Year (Symbol: CAAA10YR BVLI)
30 Year: BVAL Municipal AAA Yield Curve (Callable) 30 Year (Symbol: CAAA30YR BVLI)
Indexes used for US Treasury Yields
2 Year: US Generic Govt 2 Year Yield (Symbol: USGG2YR)
5 Year: US Generic Govt 5 Year Yield (Symbol: USGG5YR)
10 Year: US Generic Govt 10 Year Yield (Symbol: USGG10YR)
30 Year: US Generic Govt 30 Year Yield (Symbol: USGG30YR) F/m Investments, LLC, doing business as Genoa Asset Management (Genoa), is an investment advisor registered under the Investment Advisers Act of 1940. Registration as an investment adviser does not imply any level of skill or training. The oral and written communications of an adviser provide you with information about which you determine to hire or retain an adviser. For more information please visit: https://adviserinfo.sec.gov/ and search our firm name. The opinions expressed herein are those of Genoa and may not come to pass. The material is current as of the date of this presentation and is subject to change at any time, based on market and other conditions. The information presented in the material is general in nature and is not designed to address your investment objectives, financial situation or particular needs. Prior to making any investment decision, you should assess, or seek advice from a professional regarding whether any particular transaction is relevant or appropriate to your individual circumstances. The information presented does not involve the rendering of personalized financial, legal or tax advice, but is limited to the dissemination of general information for educational purposes. Please consult financial, legal or tax professionals for specific information regarding your individual situation. This information does not constitute a solicitation or an offer to buy or sell any securities. Although taken from reliable sources, Genoa cannot guarantee the accuracy of the information received from third parties. Charts, diagrams, and graphs, by themselves, cannot be used to make investment decisions. Investing involves risk of loss, including loss of principal. Past performance is no guarantee of future results. An index is a portfolio of specific securities, the performance of which is often used as a benchmark in judging the relative performance of certain asset classes. Indexes are unmanaged portfolios and investors cannot invest directly in an index. An index does not charge management fees or brokerage expenses, and no such fees or expenses were deducted from the performance shown.