Written by Sarah Conwell, Portfolio Manager
Headlines of the Week
- Watch Fed Chair Powell deliver his key Jackson Hole economic speech live
- Afghanistan Death Toll Climbs As Pentagon Clarifies 1 Bomber Was Involved In Attack
- Tropical Storm Ida Is Strengthening and Forecast To Slam Gulf Coast As A Major Hurricane Sunday
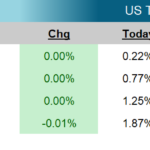
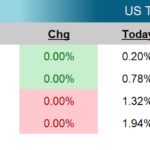
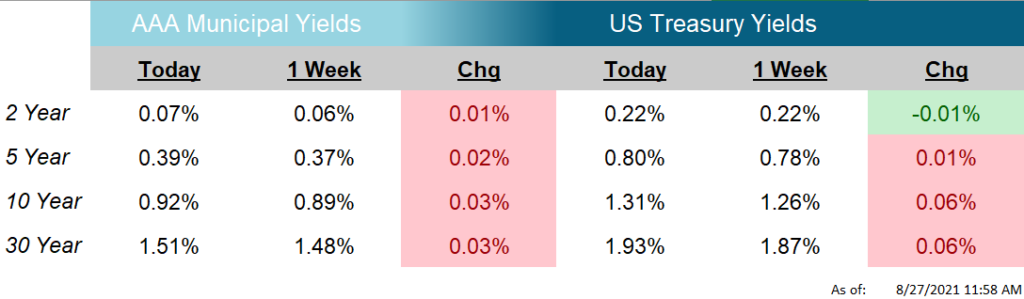
The US Treasury yield curve steepened in the week, with longer-term Treasury yields increasing as much as 6 basis points.
On Monday, the Markit Manufacturing and Services PMIs fell short of expectations, and both were below consensus estimates and their prior prints. The Manufacturing PMI was released at 61.2 versus a prior 63.4 and expectations of 62.0. The Services PMI released its figures in a similar fashion with August’s figure at 55.2, the prior at 59.9 and expectations of 59.2. Although these missed the mark, both remain firmly in expansionary territory.
The second estimate of Q2 Gross Domestic Product (GDP) was announced yesterday and increased 0.1% from the first estimate, to 6.6%. Personal consumption edged up to 11.9% from 11.8%, business investment (mainly in intellectual property and equipment) increased, and exports increased as well. As you can see in this week’s Chart of the Week, corporate profits improved 9.2% quarter-over-quarter and an impressive 43.4% year-over-year (source: Bureau of Economic Analysis). All-in-all, a relatively strong report that leaves estimates of full-year 2021 growth around 6.2%, according to Bloomberg Economics.
Next week brings another full slate of economic releases, which include: Consumer Confidence, ISM Manufacturing and Services, Durable Goods Orders, Nonfarm Payrolls, the Unemployment Rate, and the Markit PMIs.
Chart of the Week
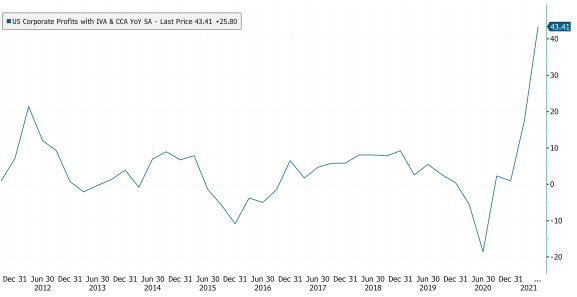
Source: Bloomberg, LLC
As of: 8/27/2021
Click on the above links for more information on important investment and economic concepts.
Disclosures
Indexes used for AAA Municipal Yields
2 Year: BVAL Municipal AAA Yield Curve (Callable) 2 Year (Symbol: CAAA02YR BVLI)
5 Year: BVAL Municipal AAA Yield Curve (Callable) 5 Year (Symbol: CAAA04YR BVLI)
10 Year: BVAL Municipal AAA Yield Curve (Callable) 10 Year (Symbol: CAAA10YR BVLI)
30 Year: BVAL Municipal AAA Yield Curve (Callable) 30 Year (Symbol: CAAA30YR BVLI)
Indexes used for US Treasury Yields
2 Year: US Generic Govt 2 Year Yield (Symbol: USGG2YR)
5 Year: US Generic Govt 5 Year Yield (Symbol: USGG5YR)
10 Year: US Generic Govt 10 Year Yield (Symbol: USGG10YR)
30 Year: US Generic Govt 30 Year Yield (Symbol: USGG30YR) F/m Investments, LLC, doing business as Genoa Asset Management (Genoa), is an investment advisor registered under the Investment Advisers Act of 1940. Registration as an investment adviser does not imply any level of skill or training. The oral and written communications of an adviser provide you with information about which you determine to hire or retain an adviser. For more information please visit: https://adviserinfo.sec.gov/ and search our firm name. The opinions expressed herein are those of Genoa and may not come to pass. The material is current as of the date of this presentation and is subject to change at any time, based on market and other conditions. The information presented in the material is general in nature and is not designed to address your investment objectives, financial situation or particular needs. Prior to making any investment decision, you should assess, or seek advice from a professional regarding whether any particular transaction is relevant or appropriate to your individual circumstances. The information presented does not involve the rendering of personalized financial, legal or tax advice, but is limited to the dissemination of general information for educational purposes. Please consult financial, legal or tax professionals for specific information regarding your individual situation. This information does not constitute a solicitation or an offer to buy or sell any securities. Although taken from reliable sources, Genoa cannot guarantee the accuracy of the information received from third parties. Charts, diagrams, and graphs, by themselves, cannot be used to make investment decisions. Investing involves risk of loss, including loss of principal. Past performance is no guarantee of future results. An index is a portfolio of specific securities, the performance of which is often used as a benchmark in judging the relative performance of certain asset classes. Indexes are unmanaged portfolios and investors cannot invest directly in an index. An index does not charge management fees or brokerage expenses, and no such fees or expenses were deducted from the performance shown.