Written by Sarah Conwell, Portfolio Manager
Headlines of the Week
- Biden signs temporary funding bill to prevent government shutdown
- Sen. Warren calls Fed Chair Powell a ‘dangerous man,’ says she will oppose his renomination
- China Hidden Local Government Debt Is Half of GDP, Goldman Says
- Two Fed officials depart amid scrutiny over investment trades
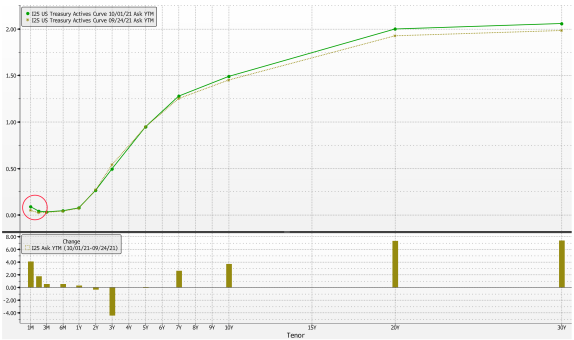
The US Treasury yield curve bear steepened in the week, the second week in a row long rates have increased at a faster pace than their shorter counterparts. It is also worth noting that Treasury Bills on the very short end of the curve (i.e. 1 month) have increased 4 basis points in the week, as the debt ceiling decision looms in Congress. You can see this movement in this week’s Chart of the Week, circled in red.
On Monday, Durable Goods Orders for August were released and were shown to have increased 1.8%. Along with the strong headline print, July’s figure was also revised a healthy 0.6 percentage points higher to 0.5% from -0.1%. Although analysts question potential adverse impacts on service spending resulting from the Delta variant, it appears as though business investment is not being impacted to the same extent.
On Thursday, the third estimate of second quarter GDP was released and was little changed at 6.7%, from 6.6%. Estimates for Q2 Personal Consumption were increased slightly to 12.0% in the same release. In this morning’s slate of economic releases, Personal Income and Spending were close to their consensus estimates, at 0.2% and 0.7% respectively. The PCE Deflator increased 0.4% in the month on a headline basis and 0.3% on a core basis. This brings the total year-over-year to change in prices to 4.3% and 3.6% on a headline and core basis. Although these levels are elevated in recent historical context, monthly price increases have begun to settle from the higher rates seen at the beginning of the year. It will take some time for bottlenecks to work their way through the system and allow prices to increase at a lower, normal pace. Realistically, this may take years.
Next week, the main releases are labor-market related with ADP Employment, Nonfarm Payrolls, the Unemployment Rate, and the Labor Force Participation Rate all on tap.
Chart of the Week
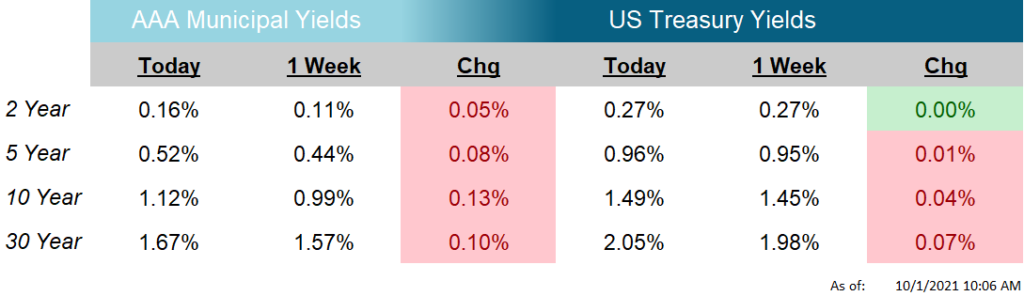
Source: Bloomberg, LP
As of: 10/1/2021
Click on the above links for more information on important investment and economic concepts.
Disclosures
Indexes used for AAA Municipal Yields
2 Year: BVAL Municipal AAA Yield Curve (Callable) 2 Year (Symbol: CAAA02YR BVLI)
5 Year: BVAL Municipal AAA Yield Curve (Callable) 5 Year (Symbol: CAAA04YR BVLI)
10 Year: BVAL Municipal AAA Yield Curve (Callable) 10 Year (Symbol: CAAA10YR BVLI)
30 Year: BVAL Municipal AAA Yield Curve (Callable) 30 Year (Symbol: CAAA30YR BVLI)
Indexes used for US Treasury Yields
2 Year: US Generic Govt 2 Year Yield (Symbol: USGG2YR)
5 Year: US Generic Govt 5 Year Yield (Symbol: USGG5YR)
10 Year: US Generic Govt 10 Year Yield (Symbol: USGG10YR)
30 Year: US Generic Govt 30 Year Yield (Symbol: USGG30YR) F/m Investments, LLC, doing business as Genoa Asset Management (Genoa), is an investment advisor registered under the Investment Advisers Act of 1940. Registration as an investment adviser does not imply any level of skill or training. The oral and written communications of an adviser provide you with information about which you determine to hire or retain an adviser. For more information please visit: https://adviserinfo.sec.gov/ and search our firm name. The opinions expressed herein are those of Genoa and may not come to pass. The material is current as of the date of this presentation and is subject to change at any time, based on market and other conditions. The information presented in the material is general in nature and is not designed to address your investment objectives, financial situation or particular needs. Prior to making any investment decision, you should assess, or seek advice from a professional regarding whether any particular transaction is relevant or appropriate to your individual circumstances. The information presented does not involve the rendering of personalized financial, legal or tax advice, but is limited to the dissemination of general information for educational purposes. Please consult financial, legal or tax professionals for specific information regarding your individual situation. This information does not constitute a solicitation or an offer to buy or sell any securities. Although taken from reliable sources, Genoa cannot guarantee the accuracy of the information received from third parties. Charts, diagrams, and graphs, by themselves, cannot be used to make investment decisions. Investing involves risk of loss, including loss of principal. Past performance is no guarantee of future results. An index is a portfolio of specific securities, the performance of which is often used as a benchmark in judging the relative performance of certain asset classes. Indexes are unmanaged portfolios and investors cannot invest directly in an index. An index does not charge management fees or brokerage expenses, and no such fees or expenses were deducted from the performance shown.