Written by Peter Baden, CFA, Chief Investment Officer
The much anticipated day came and the Fed, once again, did not disappoint. Wednesday, March 16th is the start of the next interest rate cycle. By raising the Overnight Fed Funds rate by 25 basis points, to a range of 0.25-0.5% the Fed is no longer easing but tightening. Rates were volatile, rising in anticipation, then the curve flattened later in the week. The benchmark Ten Year US Treasury started the week at 2.00% rose to a high of 2.23% (Prices fell) on Wednesday only to rally to 2.14% as of this writing (Around 1:00 Friday). Meanwhile, the two-year treasury started the week at 1.75% and was trading at 1.95% at the end of the week. The curve flattened so much, the five has the same yield (2.14%) as the ten-year and the seven-year treasury has a higher yield (2.175%) than the ten-year.
Why is the curve flattening? The anticipation of Fed rate increases affects the shorter maturity treasuries (The front end of the curve). The Fed Chairman was very clear, we can expect more increases this year, potentially one at each meeting. That would put the Overnight Fed Funds Rate at 2-2.25% by year-end. Looking into next year, the CME Fed Watch Tool (See Below) indicated rate increases at each meeting until we reach the 2.5%-2.75% range. Therefore, the front end of the curve has reacted to the potential opportunity to earn higher overnight interest rates between now and the next few years dropping prices of shorter bonds and increasing yields.
But the back end of the curve, say maturities ten years and beyond, care more about inflation and the value of the dollars that will be returned at some point in the future. With inflation running at multi-decade highs, long-term rates have adjusted somewhat higher, but not as much as short rates. This has caused the yield curve to flatten. This flattening indicates the market feels the Fed will be successful in moderating inflation.
At its most basic, inflation is the result of an imbalance of supply and demand. Not enough supply (Supply chain disruption), too much demand (Government stimulus payments) and we now have inflation (We know there are many more facets to this, we’re just keeping it basic). The Fed is attempting to slow the demand side of the equation by making funding more expensive (Raising rates). They hope to do this and engineer a “Soft Landing” also known as no recession. However, the Fed’s primary responsibility is inflation and if inflation doesn’t moderate, the Fed may keep increasing rates. Which could make front-end rates so high, they are higher than long rates, causing the curve to invert.
Curve inversion has been a good predictor of potential recessions. The most reliable indicator is the spread between two and ten-year maturities. Right now, the spread between the 2 and 10-year treasury is 19 basis points.
This does not mean we are going to have a recession soon or even have a recession. But it does show why we have maintained our position in long bonds and why we have improved the credit quality in our strategies.
We continue to monitor the curve and other indicators and will reposition portfolios as necessary as we move through this interest rate cycle into the next.
CME FedWatch Tool
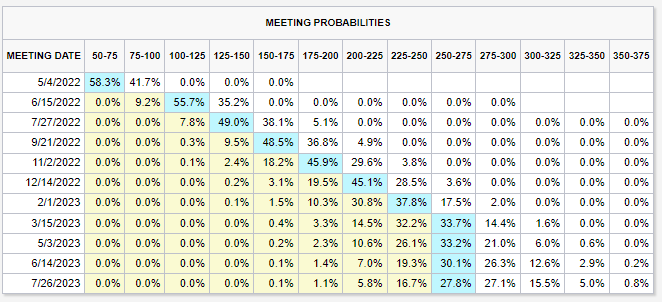
As of: 03/18/2022
Click on the above links for more information on important investment and economic concepts.
Disclosures
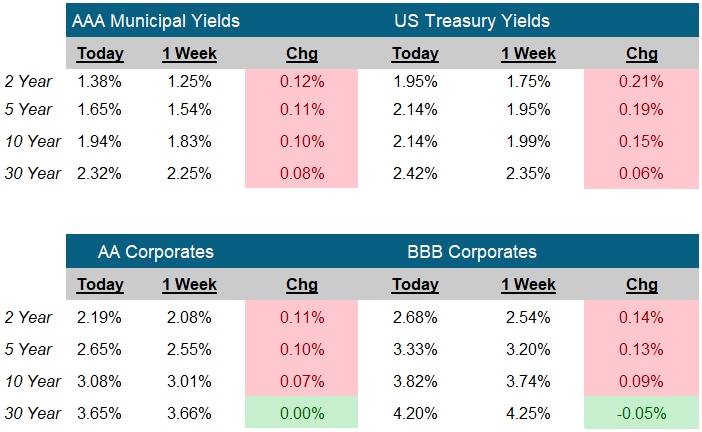
Indexes used for AAA Municipal Yields
2 Year: BVAL Municipal AAA Yield Curve (Callable) 2 Year (Symbol: CAAA02YR BVLI)
5 Year: BVAL Municipal AAA Yield Curve (Callable) 5 Year (Symbol: CAAA04YR BVLI)
10 Year: BVAL Municipal AAA Yield Curve (Callable) 10 Year (Symbol: CAAA10YR BVLI)
30 Year: BVAL Municipal AAA Yield Curve (Callable) 30 Year (Symbol: CAAA30YR BVLI)
Indexes used for US Treasury Yields
2 Year: US Generic Govt 2 Year Yield (Symbol: USGG2YR)
5 Year: US Generic Govt 5 Year Yield (Symbol: USGG5YR)
10 Year: US Generic Govt 10 Year Yield (Symbol: USGG10YR)
30 Year: US Generic Govt 30 Year Yield (Symbol: USGG30YR) F/m Investments, LLC, doing business as Genoa Asset Management (Genoa), is an investment advisor registered under the Investment Advisers Act of 1940. Registration as an investment adviser does not imply any level of skill or training. The oral and written communications of an adviser provide you with information about which you determine to hire or retain an adviser. For more information please visit: https://adviserinfo.sec.gov/ and search our firm name. The opinions expressed herein are those of Genoa and may not come to pass. The material is current as of the date of this presentation and is subject to change at any time, based on market and other conditions. The information presented in the material is general in nature and is not designed to address your investment objectives, financial situation or particular needs. Prior to making any investment decision, you should assess, or seek advice from a professional regarding whether any particular transaction is relevant or appropriate to your individual circumstances. The information presented does not involve the rendering of personalized financial, legal or tax advice, but is limited to the dissemination of general information for educational purposes. Please consult financial, legal or tax professionals for specific information regarding your individual situation. This information does not constitute a solicitation or an offer to buy or sell any securities. Although taken from reliable sources, Genoa cannot guarantee the accuracy of the information received from third parties. Charts, diagrams, and graphs, by themselves, cannot be used to make investment decisions. Investing involves risk of loss, including loss of principal. Past performance is no guarantee of future results. An index is a portfolio of specific securities, the performance of which is often used as a benchmark in judging the relative performance of certain asset classes. Indexes are unmanaged portfolios and investors cannot invest directly in an index. An index does not charge management fees or brokerage expenses, and no such fees or expenses were deducted from the performance shown.