April 1, 2022
There are many advantages to investing in bonds, but one of my favorites is the ability to forecast the future. I’m not talking about if economy is going into a recession or if the Bengals are going to win the Superbowl, I’m saying given a set of assumptions, we can calculate the value of an individual bond at some point in the future and more importantly, the holding period return.
It’s called Horizon Analysis. If I buy this bond today at certain price to earn a yield, what is the price of the bond going to be at some point in the future at another yield, and what is the total return for the period? Mind you, the future is uncertain and things like inflation, interest rates and credit could make the future yield and price very different from our assumed yield and price. But this allows us to forecast how different a bond might perform given different yields and how much the total return might be.
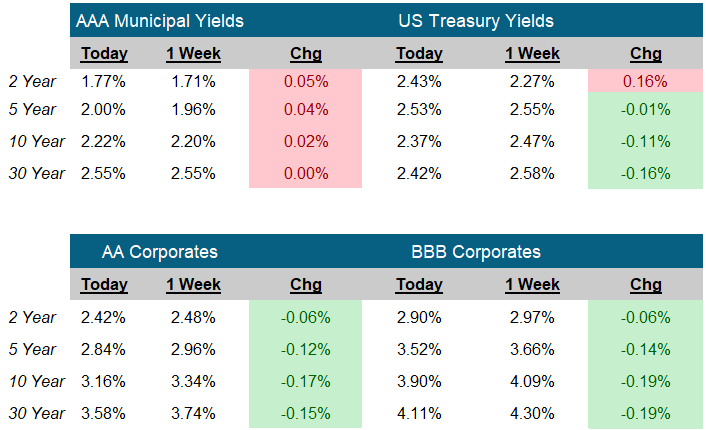
Horizon analysis got very interesting this week. The yield to maturity on the two-year US Treasury is now 2.43% (As of noon on Friday April 1, 2022). If we buy the two-year UST and hold it a year, we will get a 2.43% total return. Using horizon analysis, if the yield rises to 3.10%, we could get a total return of 1.79% or roughly the same as today’s yield on a one-year UST. If the yield should fall to say 2% we could get a 2.84% total return.
So, we asked the question, given our one year holding period, at what yield would the one-year UST have to be trading at for us to lose money? Remember, a year from now, our two-year bond is going to be a one-year bond. The answer? 4.99%. Specifically, if we buy the two-year UST at a 2.43% yield today, and if the one-year UST yield next April is below 4.99%, we will have a positive total return. And if next year, the one-year UST yield is below 3.1% we make more money than if we buy the one-year UST.
What does this tell us about the bond market? It says for the first time in a long time, we should be able to make money in the short end of the curve. Not a certainty, but if we assume a one-year UST is trading below a 4.99% yield a year from now, we can assume we can make money buying the two-year UST.
-Peter Baden, CFA
Chief Investment Officer
Click on the above links for more information on important investment and economic concepts.
Contact Genoa Asset Management
William (Kip) Weese
SVP, Intermediary Sales
Northeast & South West
(508) 423-2269
Email Kip
Art Blackman
VP, Intermediary Sales
Central
(816) 688-8482
Email Art
Rick Bell
VP, Intermediary Sales
North Central & North West
(513) 762-3694
Email Rick
Disclosures
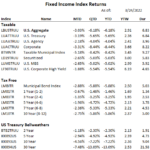
Indexes used for Fixed Income Returns
U.S. Aggregate – The Bloomberg US Aggregate Bond Index (Symbol: LBUSTRUU)
U.S. Treasury – The Bloomberg US Treasury Index (Symbol: LUATTRUU)
Corporate – The Bloomberg US Corporate Bond Index (Symbol: LUACTRUU)
U.S. Corporate High Yield – The Bloomberg US Corporate High Yield Bond Index (Symbol: LF98TRUU)
Taxable Municipal Index – The Bloomberg Municipal Index Taxable Bond Index (Symbol: BTMNTR)
Tax-Free Muni Index- The Bloomberg Municipal Bond Index (Symbol: LMBITR)
Tax-Free Muni 7-Yr Index – The Bloomberg Municipal Bond 7 Year (6-8) Index (Symbol: LM07TR)
Indexes used for AAA Municipal Yields
2 Year: BVAL Municipal AAA Yield Curve (Callable) 2 Year (Symbol: CAAA02YR BVLI)
5 Year: BVAL Municipal AAA Yield Curve (Callable) 5 Year (Symbol: CAAA04YR BVLI)
10 Year: BVAL Municipal AAA Yield Curve (Callable) 10 Year (Symbol: CAAA10YR BVLI)
30 Year: BVAL Municipal AAA Yield Curve (Callable) 30 Year (Symbol: CAAA30YR BVLI)
Indexes used for US Treasury Yields
2 Year: US Generic Govt 2 Year Yield (Symbol: USGG2YR)
5 Year: US Generic Govt 5 Year Yield (Symbol: USGG5YR)
10 Year: US Generic Govt 10 Year Yield (Symbol: USGG10YR)
30 Year: US Generic Govt 30 Year Yield (Symbol: USGG30YR) F/m Investments, LLC, doing business as Genoa Asset Management (Genoa), is an investment advisor registered under the Investment Advisers Act of 1940. Registration as an investment adviser does not imply any level of skill or training. The oral and written communications of an adviser provide you with information about which you determine to hire or retain an adviser. For more information please visit: https://adviserinfo.sec.gov/ and search our firm name. The opinions expressed herein are those of Genoa and may not come to pass. The material is current as of the date of this presentation and is subject to change at any time, based on market and other conditions. The information presented in the material is general in nature and is not designed to address your investment objectives, financial situation or particular needs. Prior to making any investment decision, you should assess, or seek advice from a professional regarding whether any particular transaction is relevant or appropriate to your individual circumstances. The information presented does not involve the rendering of personalized financial, legal or tax advice, but is limited to the dissemination of general information for educational purposes. Please consult financial, legal or tax professionals for specific information regarding your individual situation. This information does not constitute a solicitation or an offer to buy or sell any securities. Although taken from reliable sources, Genoa cannot guarantee the accuracy of the information received from third parties. Charts, diagrams, and graphs, by themselves, cannot be used to make investment decisions. Investing involves risk of loss, including loss of principal. Past performance is no guarantee of future results. An index is a portfolio of specific securities, the performance of which is often used as a benchmark in judging the relative performance of certain asset classes. Indexes are unmanaged portfolios and investors cannot invest directly in an index. An index does not charge management fees or brokerage expenses, and no such fees or expenses were deducted from the performance shown.